Key Takeaways
- Foot traffic data reveals competitor performance at a level that traditional market research cannot: visit volumes, peak hours, catchment overlaps, and expansion whitespace
- Location analytics turn publicly available movement data into competitive intelligence for marketing, operations, and site selection
- GDPR-compliant data sources are essential for EU retailers. Choose providers with anonymized, aggregated data and EU-based processing
- A structured playbook approach keeps analysis focused on decisions rather than drowning in data
- The real value comes from acting on patterns: adjusting staffing, timing campaigns, and choosing expansion markets based on observed behavior
Most retailers have a rough sense of how their competitors are doing. Foot traffic data makes that sense precise. This guide covers how to collect, analyze, and act on foot traffic intelligence, with a practical six-step playbook, GDPR compliance considerations, and tool comparisons.
Why Foot Traffic Data Matters for Competitive Intelligence
Foot traffic data makes competitor activity visible. Instead of relying on anecdotal observations or public financial reports, you can see actual visit volumes, peak hours, and catchment areas for competitor locations.
The practical applications are direct:
- Site selection: Identify high-traffic areas where your brand has no presence
- Marketing timing: Launch campaigns when competitor traffic is weakest
- Staffing and operations: Optimize hours and headcount based on observed patterns
- Expansion planning: Spot underserved areas with strong demand signals
The data reveals patterns that traditional market research misses: where competitor customers live, when they shop, how long they stay, and which locations attract the most traffic. If you are new to retail data, our beginner's guide to consumer analytics for retail covers the foundational concepts. For a platform that brings foot traffic, customer data, and location intelligence together, see Mapular's consumer analytics for retail.
What is Foot Traffic Data? (Technical Deep Dive)
Definition and Core Components
Foot traffic data measures human movement patterns to and within physical locations using aggregated, anonymized mobile location signals. Unlike traditional survey methods, this data provides continuous, real-time insights into customer behavior patterns.
Data Collection Methods
1. Mobile Location Intelligence
- GPS signals from smartphone apps (with user consent)
- Bluetooth beacons and WiFi triangulation
- Aggregated carrier data (anonymized)
- Privacy-first: No individual identification, only location-level patterns
2. In-Store Counting Technologies
- Infrared people counters
- Computer vision systems
- Thermal imaging sensors
- Door traffic sensors
3. Hybrid Approaches
- Combining mobile signals with in-store sensors
- Cross-validation for accuracy improvement
- Real-time vs. historical data analysis
Key Metrics Explained
| Metric | Definition | Competitive Intelligence Value |
|---|---|---|
| Visit Volume | Total number of visits per location/time period | Direct competitor performance comparison |
| Dwell Time | Average time spent at location | Customer engagement and experience quality |
| Catchment Area | Geographic areas visitors travel from | Market overlap and expansion opportunities |
| Peak Hours | Times of highest traffic | Operational and marketing optimization |
| Visit Frequency | How often customers return | Loyalty and retention benchmarking |
| Trade Area Overlap | Shared customer catchments between locations | Direct competitive threat assessment |
For EU retailers, data privacy compliance is non-negotiable. Quality foot traffic data providers ensure:
- Aggregation thresholds: Minimum visit volumes before reporting (typically 100+ visits)
- Anonymization protocols: No individual device tracking or identification
- Consent-based collection: Data sourced from apps with explicit user permission
- Regional compliance: GDPR, CCPA, and local privacy regulation adherence
- Transparency: Clear data sourcing and processing documentation
How Foot Traffic Data Reveals Competitor Strategies
1. Performance Benchmarking
Foot traffic data exposes the real performance story behind competitor locations. Instead of relying on public financial reports or anecdotal observations, you can see:
Visit Volume Trends: Which competitor stores are actually busy vs. those that appear busy. A premium fashion retailer discovered their "flagship" competitor location had 40% lower foot traffic than assumed, revealing market positioning opportunities.
Seasonal Patterns: How competitors adjust for seasonal demand. Electronics retailers often see different traffic patterns during back-to-school vs. holiday seasons, revealing strategic timing opportunities.
Day-of-Week Variations: When competitors are most/least busy. A furniture retailer found competitors were weak on Tuesday-Wednesday, launching targeted promotions that increased market share by 8%.
2. Catchment Area Intelligence
Understanding where competitor customers travel from reveals:
Market Penetration: Areas where competitors dominate vs. underserved neighborhoods Expansion Opportunities: High-traffic areas without your brand presence
Cannibalization Risks: How new locations might impact existing stores
Customer Journey Patterns: Whether customers visit multiple competitor locations
3. Operational Intelligence
Foot traffic data reveals competitor operational strategies:
Staffing Patterns: Peak hours requiring maximum staff allocation
Promotional Timing: When competitors run campaigns (visible through traffic spikes)
Store Format Performance: Which competitor store sizes/formats attract most traffic Location Strategy: Whether competitors prioritize high-traffic areas vs. lower-rent locations
The 6-Step Competitive Intelligence Playbook
Step 1: Define Your Competitive Set
Primary Competitors: Direct category competitors in your trade area
- Same product categories
- Similar price points
- Overlapping customer demographics
Secondary Competitors: Adjacent categories competing for customer time/wallet
- Complementary retailers (coffee shops near bookstores)
- Entertainment venues
- Service providers
Benchmark Selection: 3-5 key competitors for focused analysis
- Market leaders in your category
- Fastest-growing competitors
- New entrants with innovative approaches
Step 2: Establish Baseline Metrics
Create performance benchmarks across key metrics:
Traffic Volume Benchmarking
- Weekly visit volumes per location
- Monthly trends and seasonal patterns
- Year-over-year growth rates
Performance Indexing
- Visits per square foot
- Traffic efficiency ratios
- Peak hour capture rates
Step 3: Analyze Catchment Area Overlaps
Trade Area Mapping
- Identify primary catchment areas (70% of traffic)
- Map secondary zones (20% of traffic)
- Understand extended reach areas (10% of traffic)
Overlap Analysis
- Calculate catchment overlap percentages
- Identify contested vs. dominated areas
- Map underserved high-potential zones
Step 4: Monitor Temporal Patterns
Peak Hour Analysis
- Daily traffic patterns by competitor
- Day-of-week variations
- Seasonal trend identification
Campaign Impact Detection
- Traffic spikes during promotional periods
- Event-driven traffic changes
- Marketing campaign effectiveness
Step 5: Translate Insights into Action
Expansion Strategy
- Prioritize locations with high competitor traffic but no brand presence. Our article on site selection best practices for franchise growth outlines a proven methodology
- Avoid oversaturated areas with diminishing returns
- Consider secondary markets with growth potential
Marketing Optimization
- Time campaigns during competitor weak periods
- Target competitor catchment areas with geo-targeted advertising
- Develop counter-programming for competitor promotions
Operations Enhancement
- Adjust staffing based on competitive traffic patterns
- Optimize store hours for maximum capture
- Enhance service during competitor peak periods
Step 6: Continuous Monitoring and Adjustment
Monthly Performance Reviews
- Track competitive position changes
- Monitor new competitor locations
- Assess campaign impact on relative performance
Quarterly Strategy Updates
- Adjust competitive set as market evolves
- Refine targeting based on performance data
- Update expansion priorities
GDPR Compliance & EU Market Considerations
Why GDPR Compliance Matters for Competitive Intelligence
European retailers must navigate strict data privacy regulations while accessing competitive insights. Non-compliant data sources create legal risks and potential penalties up to 4% of annual turnover.
GDPR-Compliant Data Collection Standards
Consent-Based Data Sources
- Mobile apps with explicit location sharing permissions
- Opt-in location services with clear privacy policies
- Transparent data usage explanations
Aggregation and Anonymization Requirements
- Minimum reporting thresholds (typically 100+ visits)
- No individual device tracking or identification
- Geographic aggregation to prevent individual inference
Data Processing Safeguards
- EU-based data processing servers
- Regular data deletion protocols
- Audit trails for compliance verification
Choosing EU-Compliant Analytics Providers
When selecting foot traffic analytics providers, European retailers should verify:
GDPR Certification: Documented compliance with EU privacy regulations
Data Localization: Processing and storage within EU boundaries
Consent Documentation: Clear proof of user consent for data collection
Transparency Reports: Regular compliance and methodology updates
Legal Safeguards: Data processing agreements and liability coverage
Tool Comparison: Leading Foot Traffic Analytics Platforms
Platform Comparison Matrix
| Platform | Location | Strengths | Best For |
|---|---|---|---|
| Mapular | EU-native | EU-first privacy design, real-time dashboards, catchment overlap analysis | European retailers, privacy-conscious brands, quick implementation |
| Placer.ai | US-based | Comprehensive data, strong US coverage, detailed analytics | US-focused retailers, enterprise clients, high-volume users |
| Unacast | US/Norway-based | Location intelligence depth, API flexibility | Data-savvy teams, custom integrations, developer resources |
| SafeGraph | US-based | Developer-friendly, detailed POI data | Tech companies, data scientists, API-first approach |
| Veraset | US-based | Movement data richness, detailed insights | Large retailers, consulting firms, enterprise budgets |
Key Features for Competitive Intelligence
Essential Capabilities
- Real-time competitor benchmarking dashboards
- Catchment area mapping and overlap analysis
- Historical trend analysis (12+ months)
- Peak hour and seasonal pattern identification
- Visit frequency and loyalty metrics
Advanced Features
- Trade area competitive density analysis
- Cross-shopping behavior insights
- Demographic overlay capabilities
- Campaign impact measurement
- Predictive analytics for expansion planning
EU-Specific Requirements
- GDPR compliance certification
- Local data processing infrastructure
- Consent-based data collection
- Transparent methodology documentation
- Regular compliance auditing
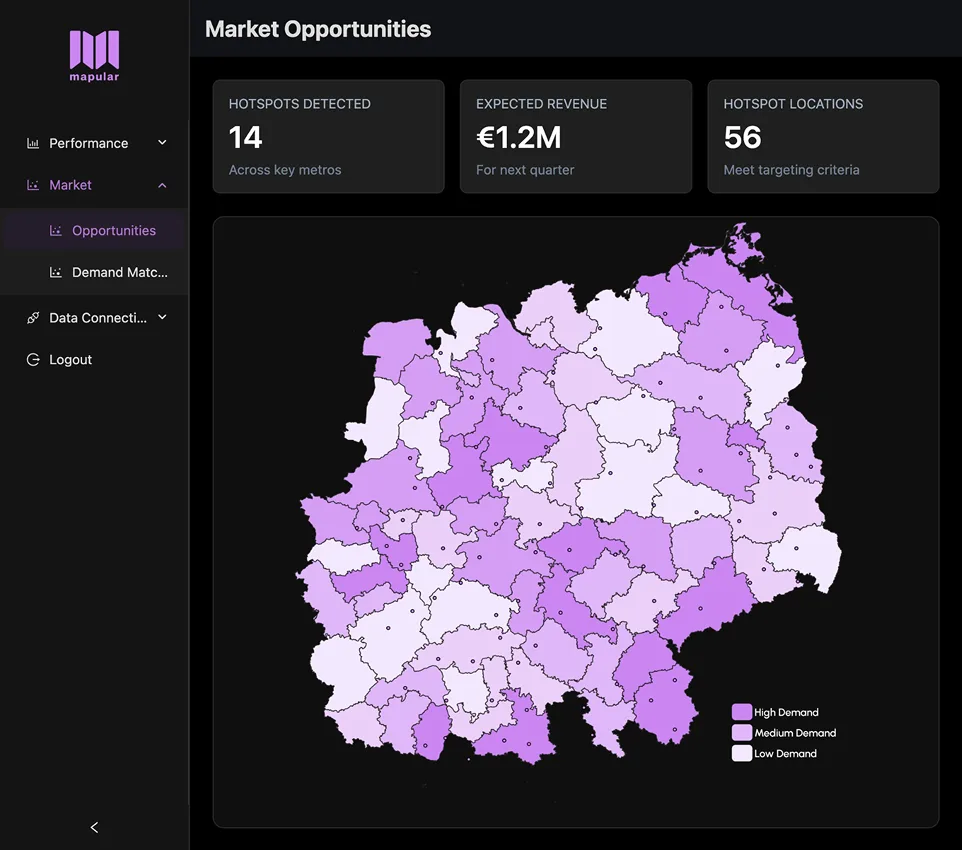
Case Study: German Fashion Retailer Expansion
The following case study is illustrative. It demonstrates how foot traffic analytics can be applied to expansion decisions. The scenario and results are hypothetical.
Challenge: A mid-market fashion retailer with 40 locations across Germany wants to expand but struggled with site selection.
Approach: Using foot traffic data, they analyzed competitor performance across 50 potential expansion markets.
Key Insights:
- Identified 3 cities with high competitor traffic but no direct competition
- Discovered underperforming competitor locations in prime areas
- Found seasonal patterns differing significantly between regions
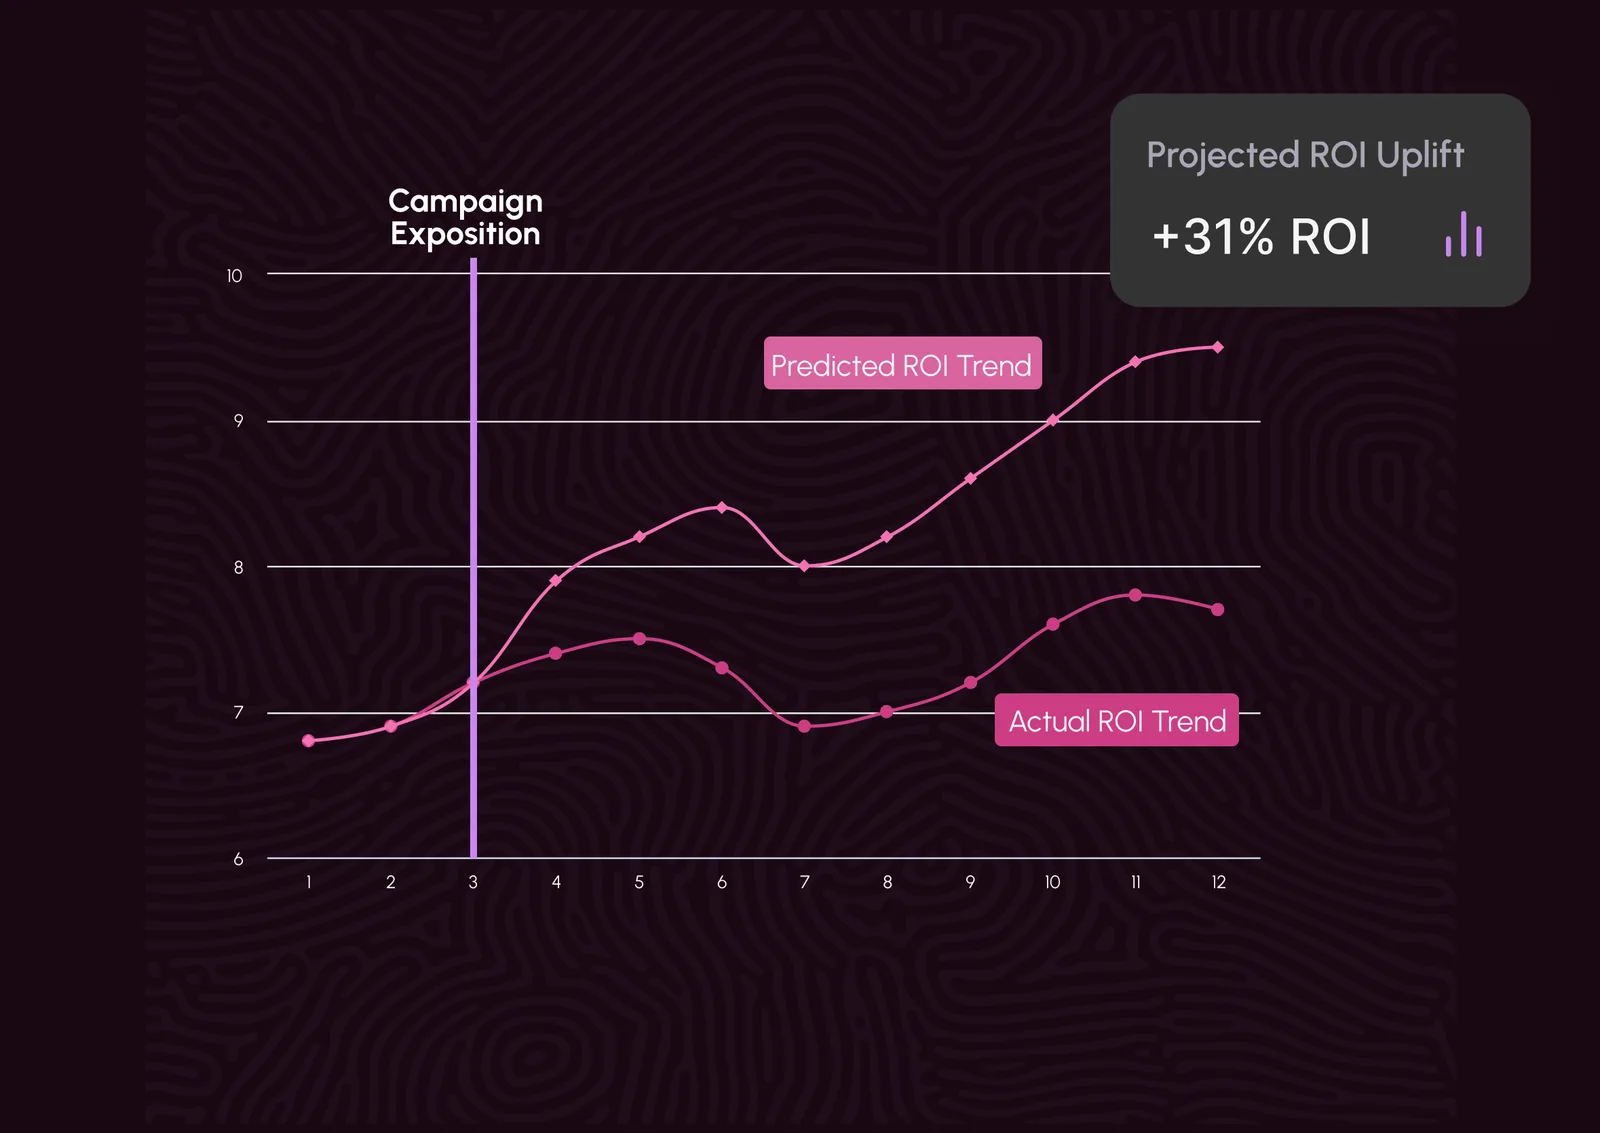
Results:
- Opened 4 new locations with 35% higher first-year traffic than projected
- Avoided 2 planned locations after discovering traffic concentration issues
- ROI improved by 42% compared to previous expansion decisions
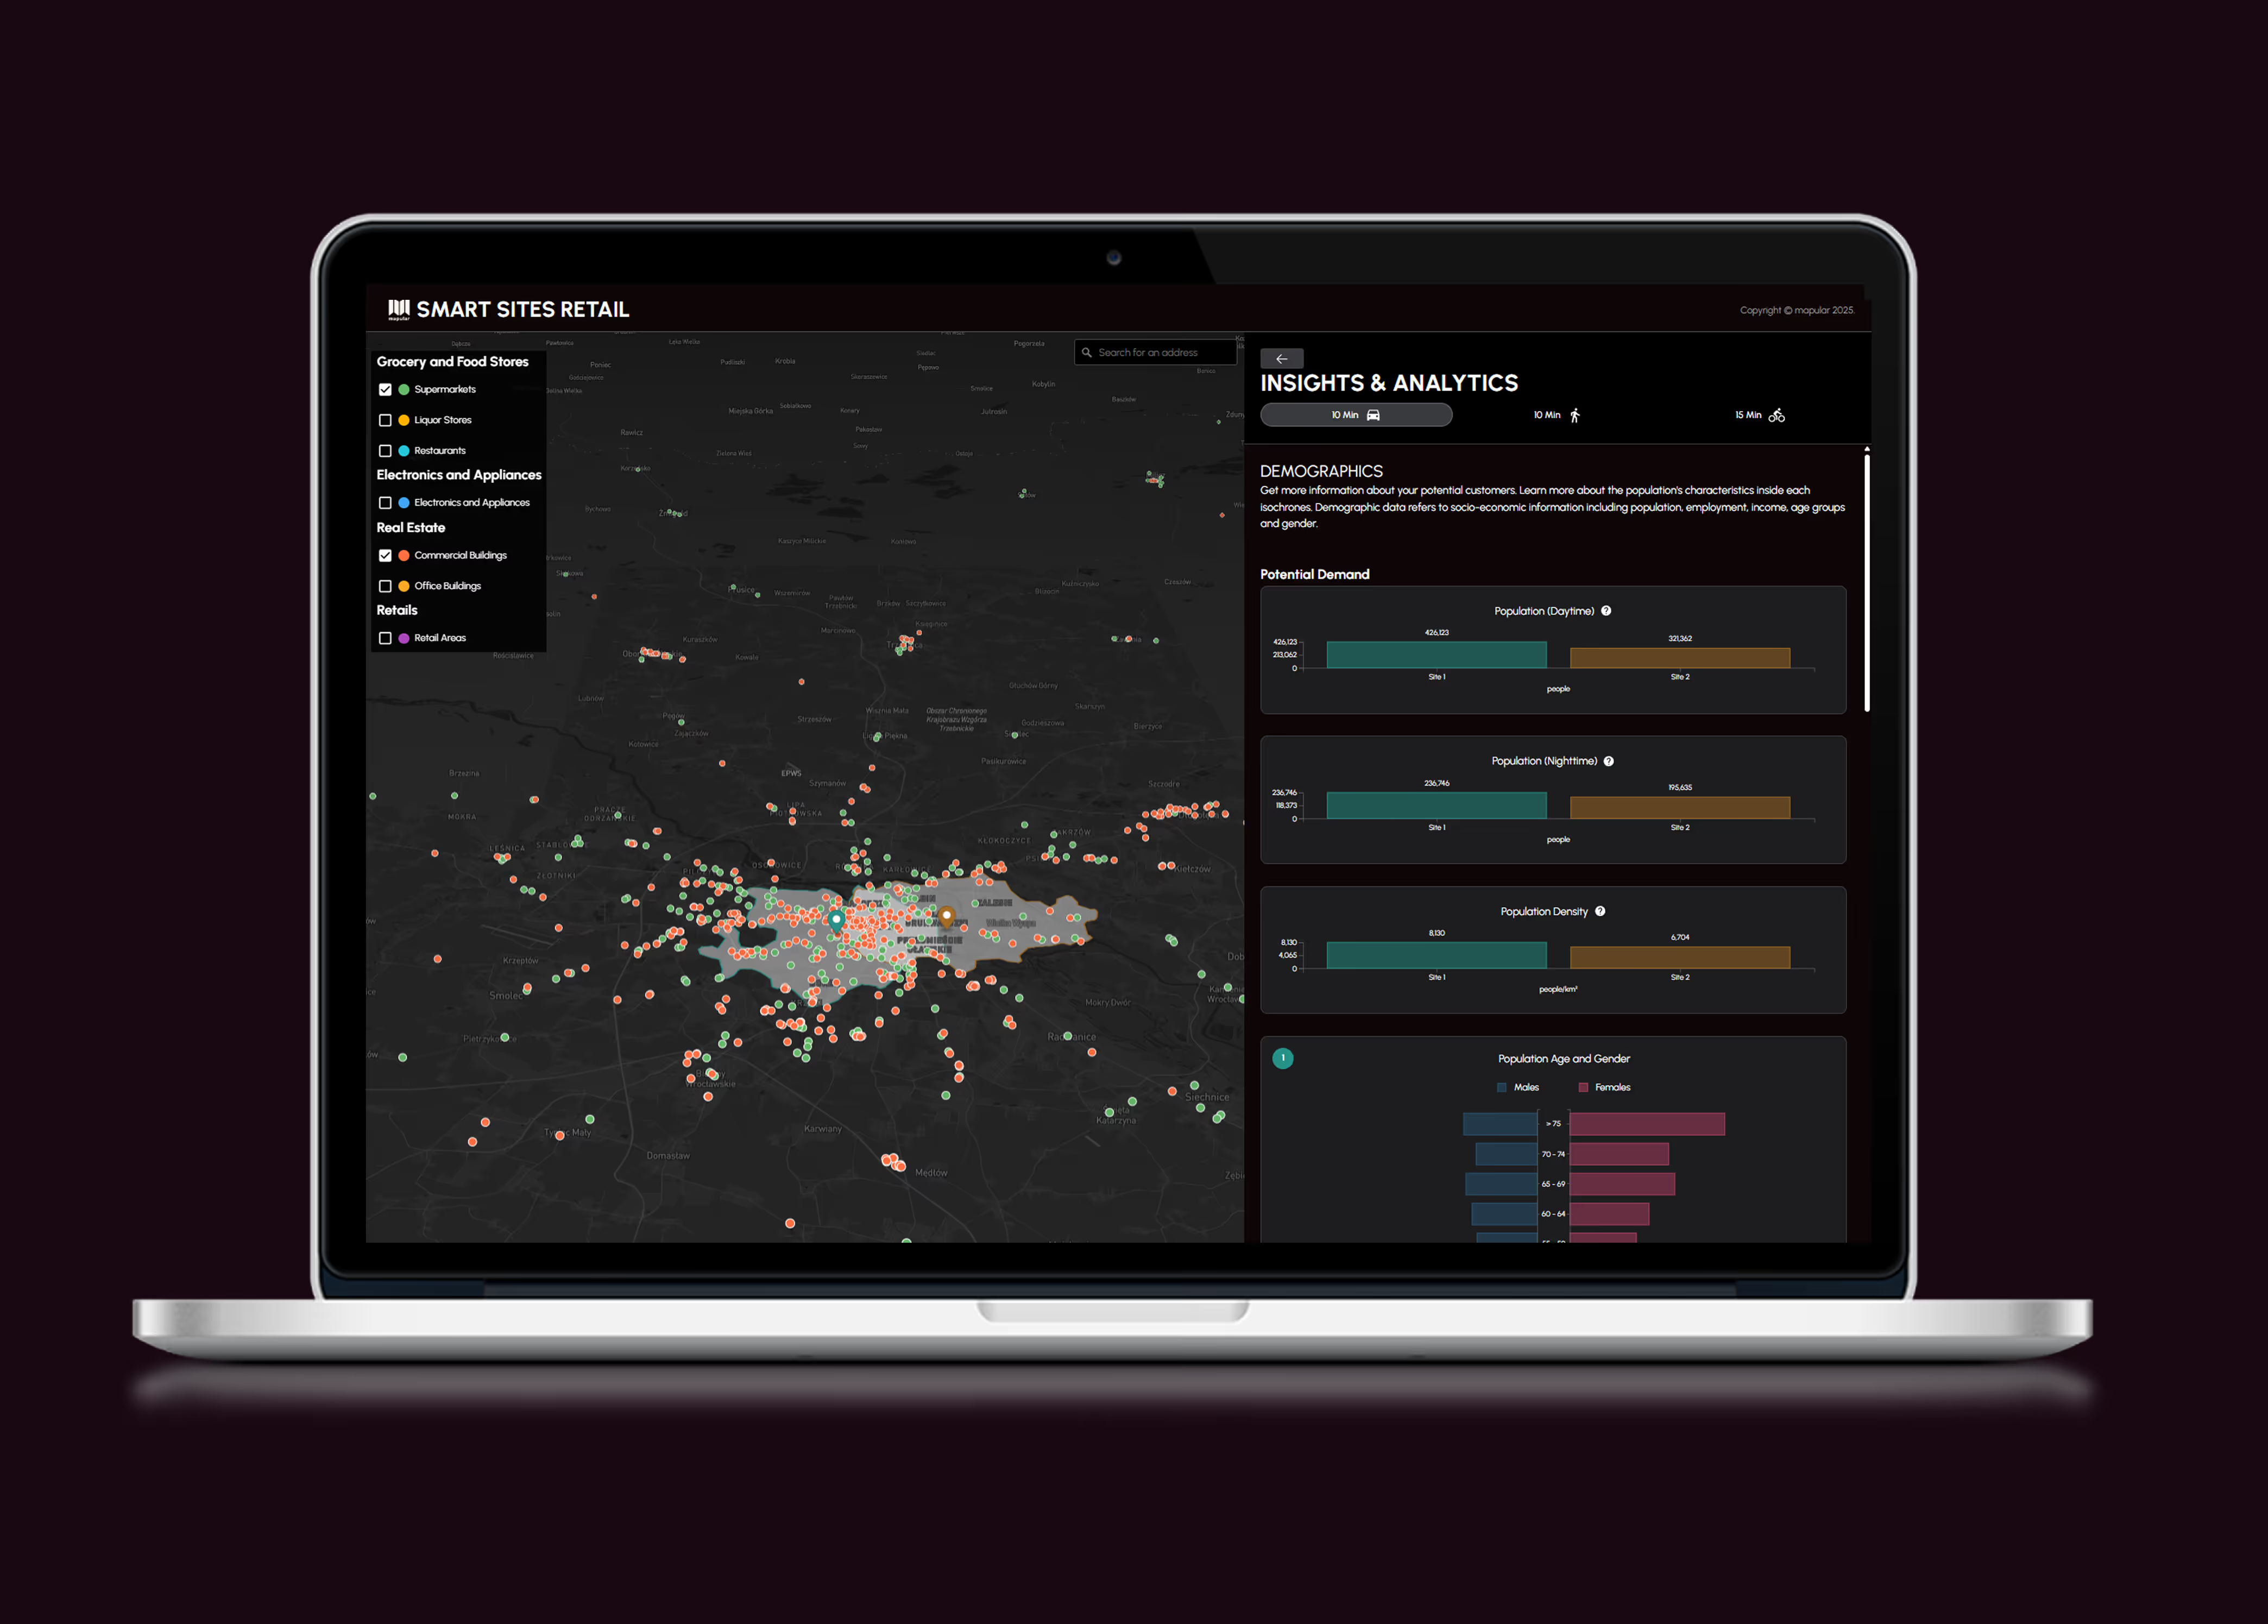
Methodology:
- Analyzed 12 months of competitor foot traffic data
- Mapped catchment areas for top 5 competitors
- Correlated traffic patterns with local demographic data
- Used predictive modeling for location scoring
Advanced Tactics for Competitive Positioning
1. Cross-Shopping Analysis
Understanding customer journeys across competitor locations reveals strategic opportunities:
Same-Day Visits: Customers visiting multiple competitors suggest category shopping behavior
Sequential Patterns: Customer progression through different retailer formats
Frequency Analysis: How often customers visit competitors vs. your locations
2. Seasonal Competitive Dynamics
Holiday Traffic Patterns: When competitors capture holiday shopping traffic
Weather Impact Analysis: How weather affects competitor vs. your performance Event-Driven Changes: Traffic during local events, sales, or disruptions
3. New Competitor Monitoring
Opening Impact Assessment: How new competitor locations affect existing traffic Ramp-Up Pattern Analysis: Typical traffic growth curves for new competitors
Market Adjustment Timelines: How long markets take to stabilize after new entrants
4. Pricing Strategy Intelligence
Promotion Detection: Traffic spikes indicating competitive promotional activity
Price War Indicators: Rapid traffic shifts suggesting pricing competition
Value Positioning: Relationship between traffic patterns and competitor pricing
5. Format Performance Analysis
Store Size Optimization: Which competitor formats attract most traffic per square foot Layout Effectiveness: Correlation between store design and dwell time
Service Model Performance: Full-service vs. self-service traffic patterns
Measuring ROI from Foot Traffic Intelligence
ROI Calculation Methods
Direct Revenue Impact
- Increased traffic from optimized locations
- Higher conversion from better timing
- Expansion success rate improvement
Cost Avoidance Benefits
- Avoided poor location decisions
- Reduced marketing waste
- Prevented competitive surprises
Operational Efficiency Gains
- Optimized staffing costs
- Improved inventory management
- Enhanced promotional timing
Performance Metrics
Short-term (0-6 months)
- Competitive benchmarking accuracy
- Marketing campaign optimization
- Operational efficiency improvements
Medium-term (6-18 months)
- Market share gains
- Expansion success rates
- Customer acquisition improvements
Long-term (18+ months)
- Overall revenue growth
- Market position strengthening
- Competitive advantage sustainability
Implementation Best Practices
1. Start with Clear Objectives
Define Success Metrics: What specific outcomes justify the investment?
Set Realistic Timelines: Allow 3-6 months for meaningful insights
Establish Baselines: Document current performance for comparison
2. Build Internal Capabilities
Team Training: Invest in analytics skills development
Process Integration: Embed insights into decision-making workflows
Technology Integration: Connect with existing business intelligence systems
3. Gradual Scaling
Pilot Programs: Start with 2-3 key markets or competitors
Proof of Concept: Demonstrate value before full rollout
Iterative Improvement: Refine approaches based on early results
4. Continuous Optimization
Regular Reviews: Monthly performance assessments
Strategy Updates: Quarterly competitive intelligence refreshes
Technology Evolution: Stay current with platform capabilities
Common Pitfalls and How to Avoid Them
1. Data Quality Issues
Problem: Inconsistent or inaccurate foot traffic data leading to poor decisions
Solution: Verify data quality through multiple sources and baseline validation
2. Analysis Paralysis
Problem: Overwhelming data volume preventing actionable insights
Solution: Focus on 3-5 key metrics aligned with business objectives
3. Privacy Violations
Problem: Using non-compliant data sources creating legal risks
Solution: Thoroughly vet provider compliance and maintain documentation
4. Short-term Thinking
Problem: Expecting immediate results from long-term strategic insights
Solution: Balance quick wins with sustainable competitive advantages
Future Trends in Foot Traffic Intelligence
1. AI-Powered Predictive Analytics
Advanced machine learning algorithms will predict competitor moves before they happen, enabling proactive strategic responses.
2. Real-Time Competitive Alerts
Instant notifications when competitors experience significant traffic changes, enabling rapid competitive responses.
3. Integrated Customer Journey Analysis
Combining foot traffic data with online behavior for complete customer journey understanding.
4. Sustainability and ESG Integration
Foot traffic analysis supporting sustainable business practices and ESG reporting requirements.
Conclusion
Foot traffic data gives retailers a factual basis for competitive decisions that would otherwise rely on assumptions. Knowing where competitors draw traffic, when they are busiest, and which areas they underserve turns strategy from guesswork into planning.
The approach that works:
- Choose GDPR-compliant, privacy-first data sources
- Build systematic competitive monitoring into your regular planning cycle
- Focus analysis on the decisions you actually need to make: site selection, campaign timing, staffing
- Review and adjust quarterly as markets shift
If you want to see how your locations compare to competitors using GDPR-compliant foot traffic analytics, book a demo with Mapular.
Frequently Asked Questions
What is foot traffic data and how is it collected?
Foot traffic data measures the number of people visiting physical locations over time using aggregated, anonymized mobile location signals from smartphone apps (with user consent), in-store sensors, or hybrid approaches. The data is privacy-compliant, showing location-level patterns without identifying individuals.
Is foot traffic data GDPR compliant for European retailers?
Yes, when sourced from compliant providers. GDPR-compliant foot traffic data requires user consent for collection, aggregation thresholds (typically 100+ visits), anonymization protocols, and EU-based data processing. Always verify provider compliance documentation.
How can retailers use foot traffic data for competitive intelligence?
Retailers can benchmark competitor store visits, analyze dwell times, map catchment areas, identify peak hours, and apply insights to expansion planning, marketing optimization, and operational improvements. The data reveals competitor performance patterns invisible to traditional research.
What's the typical ROI timeline for foot traffic analytics investments?
Most retailers see initial insights within 4-6 weeks, with meaningful business impact in 3-6 months. ROI typically improves through better site selection, marketing optimization, and operational efficiency.
How often is foot traffic data updated?
Update frequency varies by provider, from real-time to monthly reporting. High-quality platforms typically offer weekly updates for trending analysis and daily updates for operational insights. Choose update frequency based on your decision-making needs.
Can foot traffic data help with store expansion planning?
Absolutely. Foot traffic data reveals competitor visit volumes, catchment areas, and market gaps, helping identify high-potential locations with minimal competition. It also prevents expansion into oversaturated markets with poor ROI prospects. For a deeper look at choosing locations with data, see retail analytics that helps you choose the right locations.
What are the key metrics to track for competitive intelligence?
Essential metrics include visit volume, dwell time, catchment area overlap, peak hours, visit frequency, and trade area competitive density. Focus on 3-5 metrics aligned with your strategic objectives rather than tracking everything.
How do I choose the right foot traffic analytics platform?
Evaluate platforms based on data quality, GDPR compliance (for EU retailers), geographic coverage, dashboard usability, competitive benchmarking features, and integration capabilities. Consider starting with a pilot program to test effectiveness.
What's the difference between foot traffic data and traditional market research?
Foot traffic data provides continuous, objective measurement of actual customer behavior, while traditional research relies on surveys, interviews, or observational studies. Foot traffic data offers real-time insights, larger sample sizes, and eliminates response bias.
What industries benefit most from competitive foot traffic intelligence?
Retail, restaurants, healthcare, financial services, and entertainment venues benefit significantly. Any business with physical locations competing for customers can use foot traffic data for competitive intelligence, site selection, and operational optimization.
How accurate is foot traffic data compared to actual visitor counts?
Quality foot traffic data typically achieves 85%+ accuracy when properly calibrated. Accuracy depends on data sources, aggregation methods, and validation processes. Many providers offer accuracy guarantees and regular calibration against ground truth data.