In logistics, the difference between good and bad decisions often comes down to whether you can see your data geographically. Freight transport data (shipment volumes, routes, modes, origin-destination flows) is far more useful when mapped rather than tabulated. This article covers how geographic visualization of freight data supports better route planning, demand forecasting, and site selection, and introduces the Smart Transport Catalog as a practical solution for working with European freight data.
5 Powerful Use Cases of Freight Data with Geographic Visualization
1. Optimizing Route Planning
Geographic visualization of freight transport data helps identify the most efficient shipment routes by analyzing historical traffic patterns and transport volumes.
By using interactive maps to analyze past traffic data and road usage patterns, businesses can plan and optimize delivery routes, discover new export routes for specific goods, leading to cost savings and improved customer satisfaction.
2. Enhancing Demand Forecasting
Visualizing historical freight data geographically allows businesses to predict future demand more accurately.
Companies can integrate historical freight data with geographic visualization to forecast seasonal demand spikes. By understanding regional demand variations, they can ensure optimal stock levels and warehouse space, leading to a more agile and responsive supply chain. For a broader primer on turning geographic data into business decisions, see our beginner's guide to consumer analytics for retail.
3. Conducting Site Selection Analysis
Freight transport data with geographic visualization enables informed decisions about where to locate new facilities such as terminals, distribution centres, or stores.
By examining data on freight volumes, types of goods transported, and transport routes, businesses can identify optimal locations for new infrastructure. Geographic visualization through NUTS levels helps determine the best sites to minimize logistics costs and maximize service coverage.
4. Assessing Geopolitical Impacts
Geographic visualization of freight data helps understand the impact of geopolitical issues on the transport of specific goods between regions.
Analyzing how geopolitical events, such as trade embargoes, affect transport routes and costs for certain products. By visualizing these impacts geographically, businesses can adapt their logistics strategies, find alternative routes, and mitigate risks, ensuring continuous supply chain operations.
5. Enhancing Intermodal Transport Efficiency
Geographic visualization of freight transport data helps optimize the use of multiple transport modes to enhance overall efficiency.
Businesses can analyze the interplay between different transport modes (e.g., ships, trucks, trains, airplanes) to create more efficient and cost-effective logistics strategies. By identifying the best modal combinations and routes, companies can reduce transportation costs and decrease environmental impact.
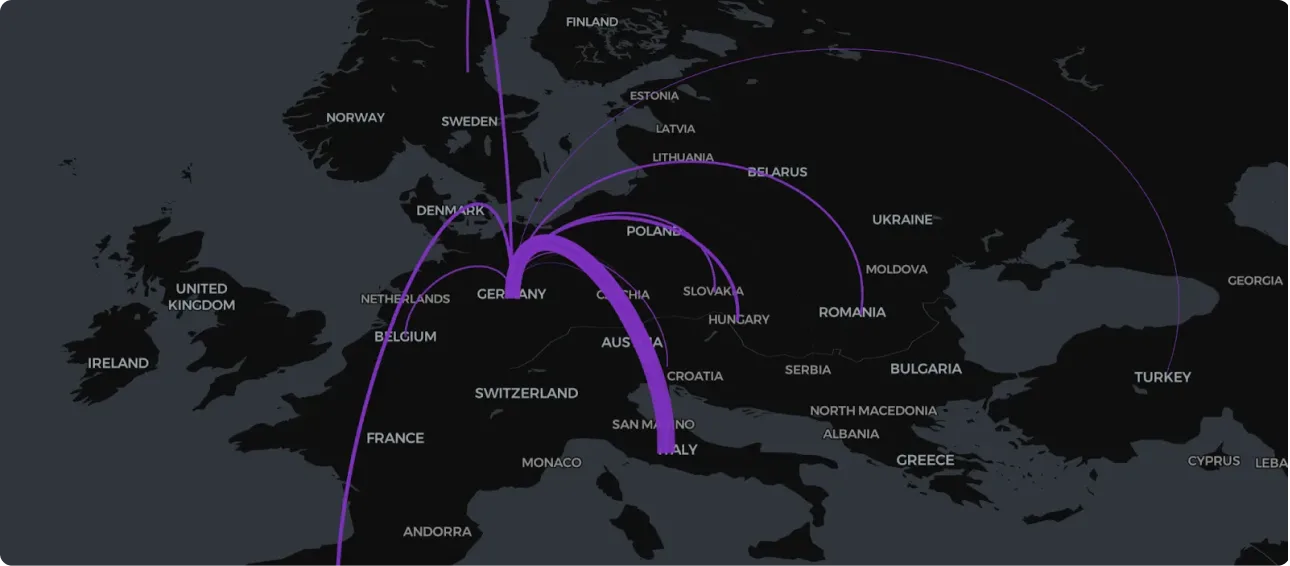
These use cases show how geographic visualization adds a spatial dimension to freight data that spreadsheets and dashboards alone cannot provide. In urban environments, the same principles apply to passenger transport and road safety; see how SmartDrive AI is shifting urban mobility management from analog to digital.
Handling and Visualizing Data from Eurostat: Insights and Challenges
Among the most invaluable sources of data for the freight transport sector is Eurostat, the statistical office of the European Union. Eurostat provides a comprehensive and detailed collection of transport data and encompasses a wide range of transport modes, including road, rail, maritime, and air, collected from all EU member states and several partner countries. One of the key advantages of Eurostat data is its standardization. Eurostat employs consistent methodologies and classifications, such as the Nomenclature of Territorial Units for Statistics (NUTS), ensuring that data from various countries and regions is comparable.
This extensive coverage provides a holistic view of freight transport activities across Europe, enabling stakeholders to grasp regional and international transport dynamics. Open data initiatives like Overture Maps are fusing open and commercial datasets to set new standards in mapping, complementing sources like Eurostat. However, despite the potential of these datasets, there are practical challenges in working with them.
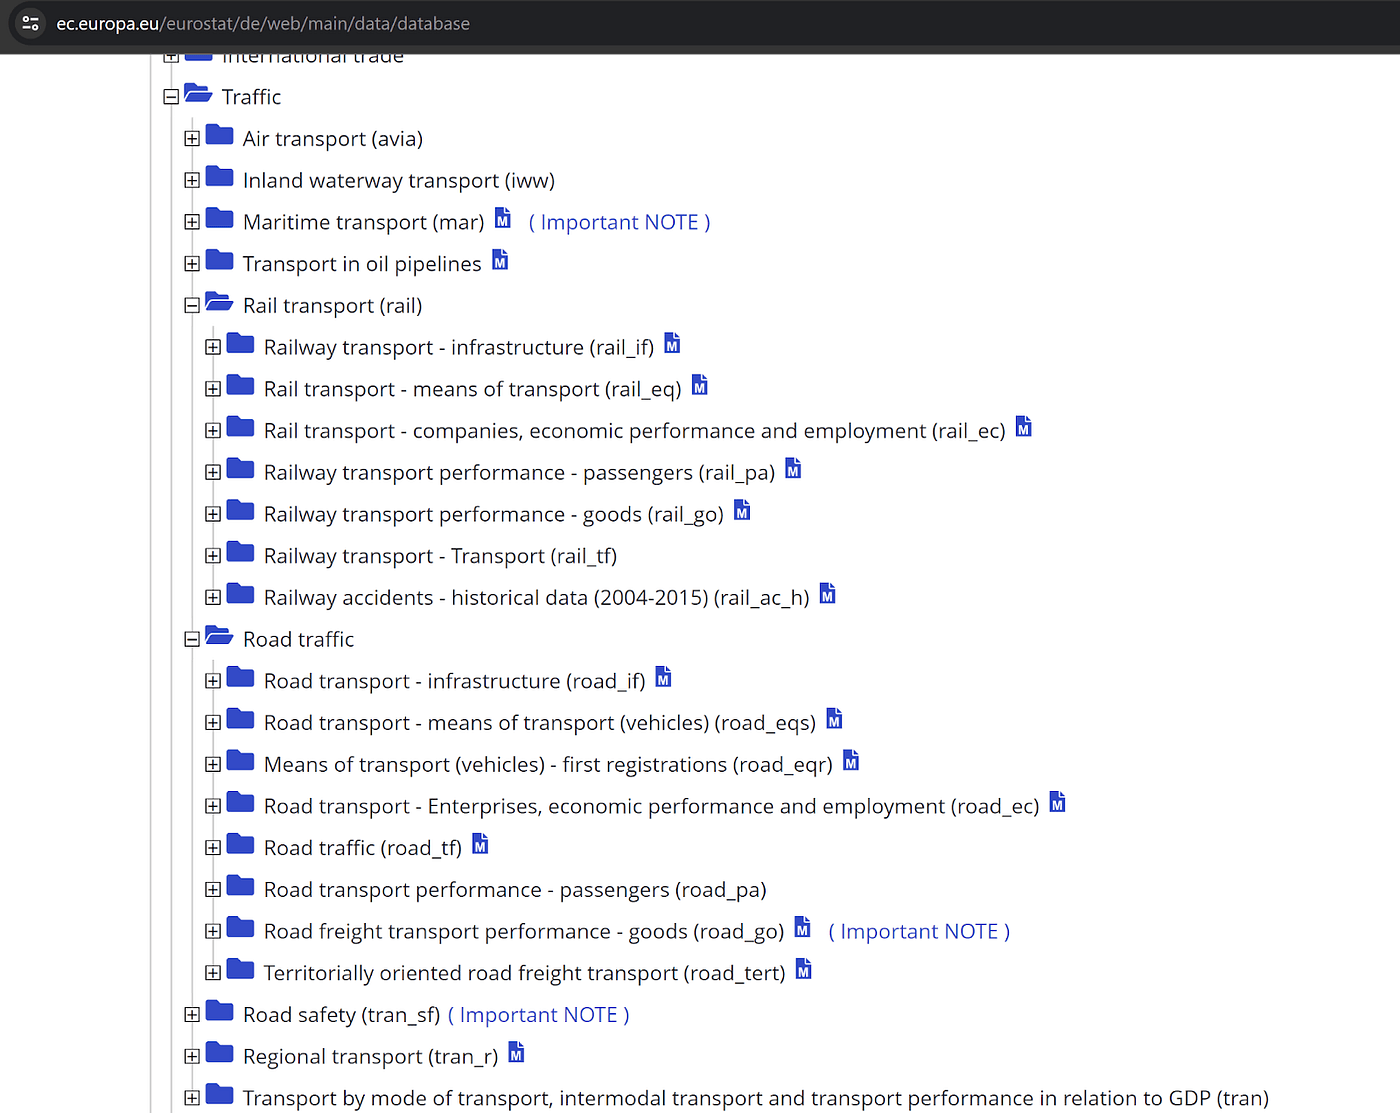
Challenges of Merging and Visualizing Eurostat Data
Merging and visualizing Eurostat data, especially when it involves geographical information, presents several practical challenges.
- Finding the Right Datasets: It is not easy to locate the specific datasets needed due to the vast amount of data available.
- Data Preparation and Cleaning: Ensuring codes are correct and consistently formatted across datasets is time-consuming.
- Geographical Mapping: Eurostat provides data in formats like CSV, TSV, and SDMX, but it lacks latitude, longitude, and geom fields. Users must merge Eurostat data with other geographic datasets for spatial analysis or mapping.
- Consistency and Updates: Keeping data and boundary files updated and consistent over time is challenging.
- Missing or Incomplete Data: Handling gaps in the data to avoid misleading visualizations is crucial.
Eurostat Catalog
Introducing the Smart Transport Catalog
The Smart Transport Catalog addresses these challenges by combining Eurostat datasets with geographic components, all pre-processed into a unified, ready-to-use format.
Why Choose the Smart Transport Catalog?
- Comprehensive Data Offering: The Smart Transport Catalog provides a wide range of datasets covering various aspects of freight transport, including international and national road transport, origin-destination flows, and more. Datasets are also segregated by type of goods and transport ownership, providing detailed insights.
- Ready-to-Use Data: All data is pre-processed and ready for immediate use, saving businesses time and resources on data cleaning and preparation.
- Integrated Geographic Visualization: The platform includes advanced tools for geographic visualization, making it easier to analyze transport routes, identify trends, and make informed decisions.
- User-Friendly Interface: The platform is designed for both technical and non-technical users, reducing the learning curve for geographic freight analysis.
- Flexible Access: Access data via API for real-time integration, or download datasets for offline analysis with bulk download support.
Get Started
Whether you work in logistics, manufacturing, retail, or export, the Smart Transport Catalog provides a practical starting point for geographic freight analysis. Pre-processed data means less time cleaning and more time making decisions. Get in touch to learn more about accessing the catalog.