Key Takeaways:
- Retail analytics becomes strategic when it connects sales, marketing, and demographic data to reveal geographic patterns of demand
- Location decisions require multiple data dimensions, not single metrics; combining foot traffic, purchasing power, and competitive density creates a complete picture
- A structured evaluation framework prevents expensive real estate mistakes driven by gut instinct or incomplete information
- Common pitfalls include over-reliance on historical sales data, ignoring cannibalization risk, and treating all markets as equivalent
- Actionable analytics means delivering prioritized regions and specific next steps, not just dashboards full of charts
Most retail brands already sit on a wealth of data. Sales figures, advertising performance, customer orders, regional demographics. The problem is rarely a lack of information. It is the absence of synthesis. These signals live in silos, each telling part of the story but never combining into a coherent geographic picture of where to grow next.
This article explores how retail analytics can move beyond reporting into genuine location guidance, helping you evaluate regions, avoid common traps, and build a repeatable framework for expansion decisions.
The Problem: Data Without a Strategic Path Forward
Your brand likely collects retail-related data from a dozen sources. Shopify tells you where orders ship. Google Ads tells you where clicks come from. Your CRM reveals purchase frequency by region. Census data tells you about income and household composition.
Individually, these signals are useful. Together, they could show you exactly where to open next, where to invest in marketing, and where to pull back. But without intentional synthesis, most brands face the same set of challenges:
- High online demand in a region does not guarantee a physical store will thrive there
- Marketing impressions do not always translate into real local visits or purchases
- Regions with existing retail presence may be overserved, while high-potential areas remain invisible
- Many brands delay expansion decisions waiting for analytics to "mature," when they could act sooner with the right framework
The cost of getting location decisions wrong is significant. Unlike a marketing campaign you can pause or a pricing strategy you can adjust, a retail lease locks you in for years. That makes the stakes for location analytics fundamentally different from other business intelligence.
Types of Location Analytics That Drive Expansion Decisions
Not all analytics are equally useful for location decisions. Understanding the different layers helps you build a complete picture rather than relying on a single metric.
Demand Analytics
Demand analytics answer the question: where are people already showing interest in your brand or category? This layer includes online order density, store locator search volume, email signup geography, and advertising engagement by region. Demand signals are the most direct indicator of where pull already exists.
For a deeper look at how to capture and interpret demand signals from your existing customer touchpoints, see our beginner's guide to consumer analytics for retail.
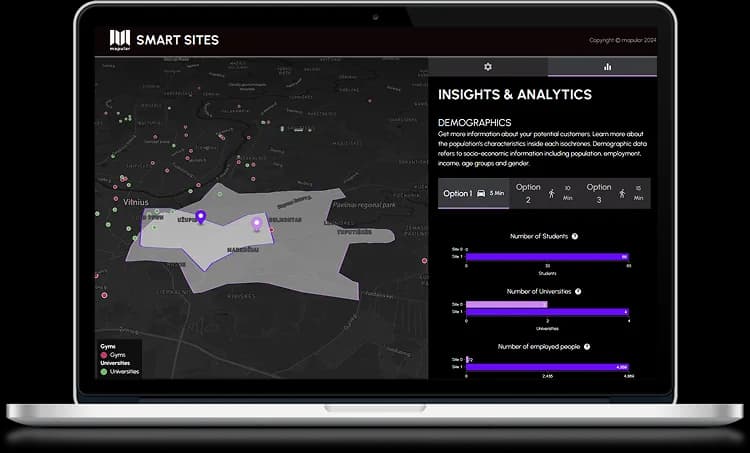
Demographic and Socioeconomic Analytics
These are the market fundamentals: population density, age distribution, household income, education levels, and purchasing power indices. Demographics help you understand whether a region has the right customer profile for your brand, independent of whether those customers have discovered you yet.
Foot Traffic and Mobility Analytics
Foot traffic data reveals how people actually move through an area. It shows pedestrian flow near potential sites, visit frequency to competing locations, and seasonal patterns that affect retail performance. Brands that use foot traffic data for competitive intelligence gain a significant edge in understanding not just who lives in an area, but how they behave within it.
Competitive Density Analytics
Understanding the competitive landscape is essential. How many direct competitors operate within a given trade area? Are anchor tenants nearby drawing the right kind of foot traffic? Is the market saturated, or is there genuine whitespace? Competitive density analytics prevent you from entering markets where the supply of similar offerings already exceeds local demand.
Performance Benchmarking Analytics
If you already operate multiple locations, comparing their performance against the characteristics of their trade areas creates a powerful feedback loop. Which demographic profiles correlate with your top-performing stores? What foot traffic thresholds separate strong locations from weak ones? These benchmarks become your location selection criteria.
Building an Evaluation Framework for Location Decisions
Raw data layers are necessary but insufficient. What turns analytics into action is a structured evaluation framework that makes locations comparable and decisions transparent.
Step 1: Define Your Ideal Location Profile
Start by describing what a strong location looks like for your specific format. This is not generic retail wisdom. It is a profile built from your own performance data combined with market characteristics. Consider:
- Minimum population within a defined travel-time catchment
- Income thresholds that align with your price point
- Presence of complementary retail anchors
- Acceptable competitive density range
- Accessibility and visibility requirements
Step 2: Layer Your Data Sources
Once you have a location profile, combine your data sources to evaluate each candidate region. The most effective approach includes at least three data types:
- First-party demand signals (where your customers already are)
- Third-party demographic data (whether the market fits your profile)
- Competitive and commercial context (what the landscape looks like on the ground)
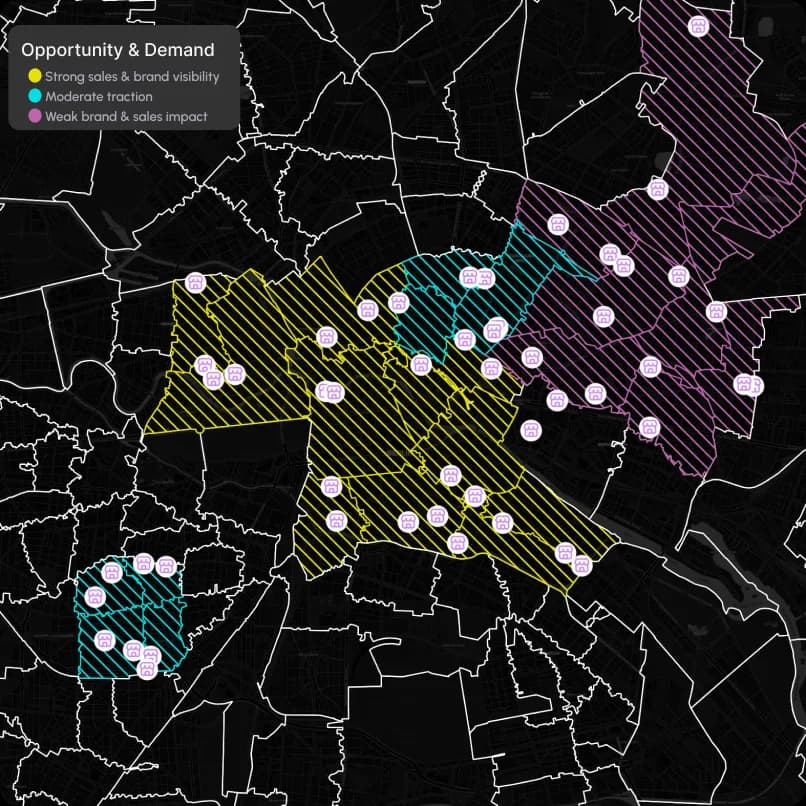
Zones that show strong demand signals AND above-average purchasing power but few competing retail presences are especially interesting. Meanwhile, areas with heavy marketing spend but flat conversion performance become warning flags worth investigating.
Step 3: Score and Rank Regions
Create a scoring system that weights each factor according to your priorities. Some brands weight demand signals heavily because they prefer to expand where pull already exists. Others weight demographics more because they are entering new markets where brand awareness is still low.
The key is consistency. Every region should be evaluated against the same criteria, making comparison straightforward and reducing the influence of individual bias or anecdotal impressions.
Step 4: Validate With Ground Truth
Analytics narrow the field, but they do not replace site visits and local knowledge. Use your scored shortlist to prioritize where to invest time in on-the-ground validation. This includes visiting the trade area, assessing visibility and access, speaking with local commercial agents, and understanding the qualitative factors that data alone cannot capture.
For brands operating in franchise models, this evaluation framework aligns closely with site selection best practices for franchise growth, where standardized territory packs and consistent scoring create transparency for franchisees and headquarters alike.
Common Pitfalls in Retail Location Analytics
Even brands with strong data practices fall into traps when applying analytics to location decisions. Recognizing these patterns helps you avoid expensive mistakes.
Pitfall 1: Over-Reliance on Historical Sales Data
Past sales performance tells you where you have succeeded, not where you could succeed. Brands that only look at historical data tend to cluster new locations near existing ones, missing entirely new markets where latent demand exists but has never been activated.
Pitfall 2: Treating Demographics as Destiny
A region with the right income and age profile does not automatically support a new location. Demographics describe potential, not certainty. Without layering in demand signals, competitive context, and accessibility data, you risk expanding into markets that look good on paper but underperform in practice.
Pitfall 3: Ignoring Cannibalization Risk
Opening a new location too close to an existing one can split your customer base rather than grow it. Cannibalization analysis, which models the overlap between trade areas, should be part of every evaluation. This is especially critical for brands in growth mode that are eager to add locations quickly.
Pitfall 4: Confusing Marketing Performance With Market Potential
Strong advertising metrics in a region might reflect effective marketing rather than genuine market demand. If you pull back ad spend and see interest evaporate, the market signal was artificial. True market potential persists even when marketing budgets shift.
Pitfall 5: Waiting for Perfect Data
Many growth teams stall, saying "analytics is not ready yet." The reality is that perfect data does not exist. What matters is consistent, explainable data applied within a structured framework. Brands that wait for perfection lose sites to competitors who act on good-enough intelligence.
From Data to Direction: How Mapular Supports Retail Location Decisions
Your goal is not analytics for its own sake. You want to act: open, test, partner. That is how Mapular positions location analytics, as a productized service rather than a tool you have to build or maintain.
The process follows three steps:
Connect Your Data
You share sales data from Shopify or your commerce platform, advertising performance from Meta and Google, and any first-party signals like store locator usage or CRM geography. Mapular enriches this with demographic and regional market indicators such as purchasing power, population density, and competitive context.
Run the Analysis
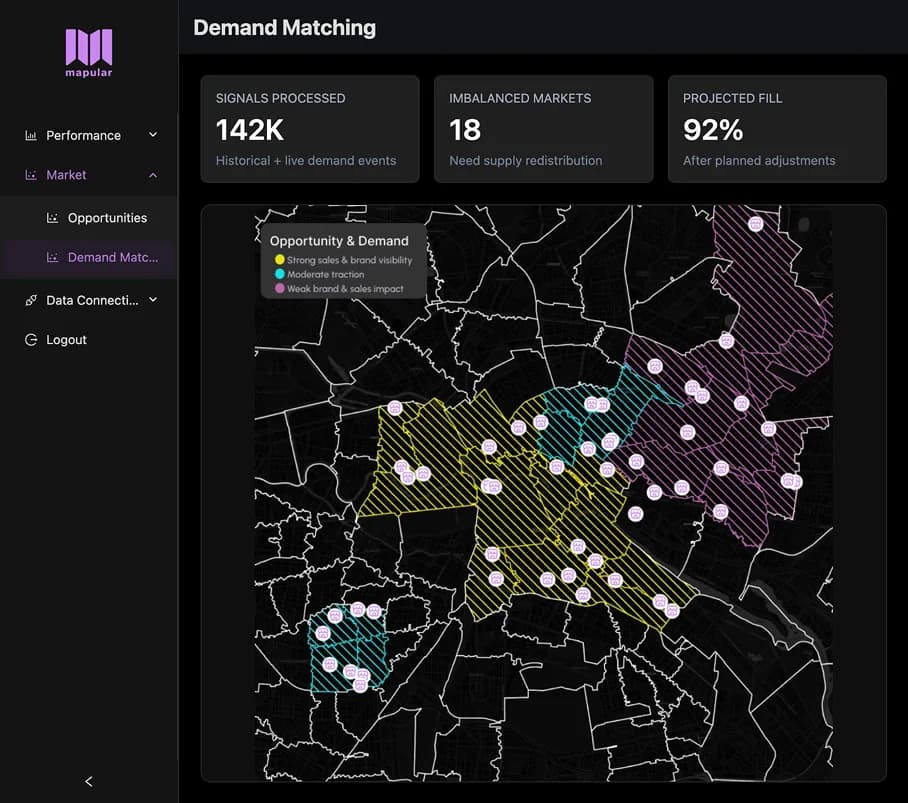
Mapular analyzes neighborhood-level overlap between your audience reach, conversion strength, and market potential. The analysis identifies geographic patterns that would take weeks to uncover manually, surfacing regions where multiple positive signals converge.
Deliver a Growth Map
You receive a visual map plus prioritized ZIP codes or postal zones, showing which regions merit further exploration and which are lower priority. Instead of another dashboard to monitor, you get insight you can act on immediately.
One brand working with us summarized the approach: "We now have proof of which areas are under the radar, instead of guessing where they were."
Why This Matters More Than Dashboards Alone
Dashboards tell you what happened in past months. Growth maps point to what to try next. That distinction matters because location decisions are forward-looking by nature. You are not choosing where to have been; you are choosing where to be.
A single metric like ad spend cannot contextualize location potential. Neither can a single data layer like demographics. The value of retail analytics for location decisions comes from combining multiple signals into a coherent geographic view that reduces uncertainty and focuses your expansion resources.
Conclusion
Retail analytics does not need to be a long-term project or a complex system to build. It can be a focused, spatial insight tool you use to evaluate regions more intelligently and move forward with confidence.
The brands that grow most efficiently are the ones that treat location decisions with the same analytical rigor they apply to product development or marketing optimization. They layer their data, build consistent evaluation frameworks, learn from their pitfalls, and act on synthesized intelligence rather than isolated signals. For a step-by-step guide to turning this analysis into an actionable growth plan, see how to plan next year's retail growth with demand data.
If you want to turn your data into directional clarity, explore Retail Opportunity Mapping and see which regions are worthy of your next move.