Key Takeaways
- Historical sales data shows where you already sell, but it does not reveal where unmet demand exists or where your next listing could perform best.
- Demand signals fall into three categories: direct purchase signals (orders, locator searches), engagement signals (email, web traffic), and market context signals (demographics, competition, foot traffic).
- Retail Opportunity Mapping combines these signals into a ranked, geographic view of expansion potential, delivered in under 14 days.
- Integrating demand signals into annual planning, quarterly reviews, and retailer negotiations creates a repeatable growth process rather than a one-time exercise.
- Five KPIs, including sell-through rate, online-to-offline conversion, and acquisition cost by region, close the loop between planning and performance.
When planning next year's retail expansion, most teams already rely on plenty of data: sales numbers, retailer reports, campaign results, and of course, years of on-the-ground experience.
But as one of our customers recently put it, sometimes it still feels like looking into a crystal ball.
Because while these insights show where sales happen, they rarely reveal where demand is not yet met. And it is in those unmet demand zones, the regions where customers are searching, clicking, and engaging but cannot find your product on a shelf, that the most valuable growth opportunities sit.
That is exactly where Retail Opportunity Mapping comes in. It bridges the gap between what your historical data tells you and what the market is actually ready for.
Why Great Teams Still Miss Great Opportunities
Even data-savvy consumer brands run into one recurring challenge: their datasets describe the past, not the potential.
Sales reports tell you where your listings perform. Retailer data shows where you are already on the shelf. Campaign metrics reveal where your ads get clicks. But none of that tells you where your category is underserved, or where your next listing could perform well.
The issue is not a lack of data. It is a lack of the right data lens, one that looks forward rather than backward and connects signals across channels rather than examining them in isolation.
So despite solid insights, teams can struggle to:
- Build a stronger case for new listings with retailer-ready demand proof
- Prioritize regional activations and trade budgets where demand is highest
- Identify high-potential, underserved regions to inform future expansion
- Distinguish between regions that are genuinely underserved and regions that simply have lower affinity for your brand
This last point is critical. Not every region without retail coverage represents an opportunity. Some regions lack coverage because demand is genuinely low there. The value of demand data is that it separates the two, telling you not just where you are absent, but where your absence is costing you revenue.
Types of Demand Signals That Matter
Before diving into the methodology, it helps to understand the specific demand signals that power an effective retail growth analysis. Not all data is equally useful, and the most actionable insights come from combining multiple signal types.
Direct Purchase Signals
These are the strongest indicators because they represent actual transactions or transaction intent:
- E-commerce order data. Geographic distribution of your online orders, broken down by zip code, reveals where customers are already buying your product. High order density in a region with low retail coverage is a clear expansion signal.
- Store locator searches. When customers search for your product on your store locator, they are expressing immediate purchase intent. Regions with high search volume but few results are flagging unmet demand in real time.
- Subscription and repeat purchase patterns. Customers who reorder regularly represent reliable demand that a nearby retail location could capture more conveniently.
Engagement Signals
These indicate interest and awareness, which often precede purchase:
- Email and SMS engagement. Open rates, click-through rates, and conversion rates by region from platforms like Klaviyo reveal where your most engaged audience lives.
- Website traffic and social interaction. Product page views, time-on-site metrics, and geographic patterns in social engagement show where interest is concentrated but has not yet converted to retail availability.
Market Context Signals
These provide the demographic and competitive backdrop:
- Purchasing power index. Average household income and disposable spending data help assess whether a region's population can support your price point.
- Population density and age distribution. Ensure the region has sufficient population matching your target demographic.
- Competitive presence. Understanding where competitors are distributed, and where they are not, reveals gaps in coverage that your brand can fill.
- Foot traffic density. Aggregated foot traffic data for retail corridors and shopping centers indicates the commercial vibrancy of an area.
The value of consumer analytics is in combining these signal types. A region might have high e-commerce order volume but low purchasing power, suggesting that online sales there are driven by promotions rather than organic demand. Alternatively, a region might show moderate order volume but exceptionally high engagement signals and favorable demographics, indicating strong latent demand that retail presence could capture.
What Retail Opportunity Mapping Brings to the Table
Retail Opportunity Mapping by Mapular helps omnichannel brands plan retail growth with confidence. Instead of starting from scratch or hiring a BI team, brands get a ready-made view of where unmet demand exists and how that overlaps with their current retail coverage.
The output includes:
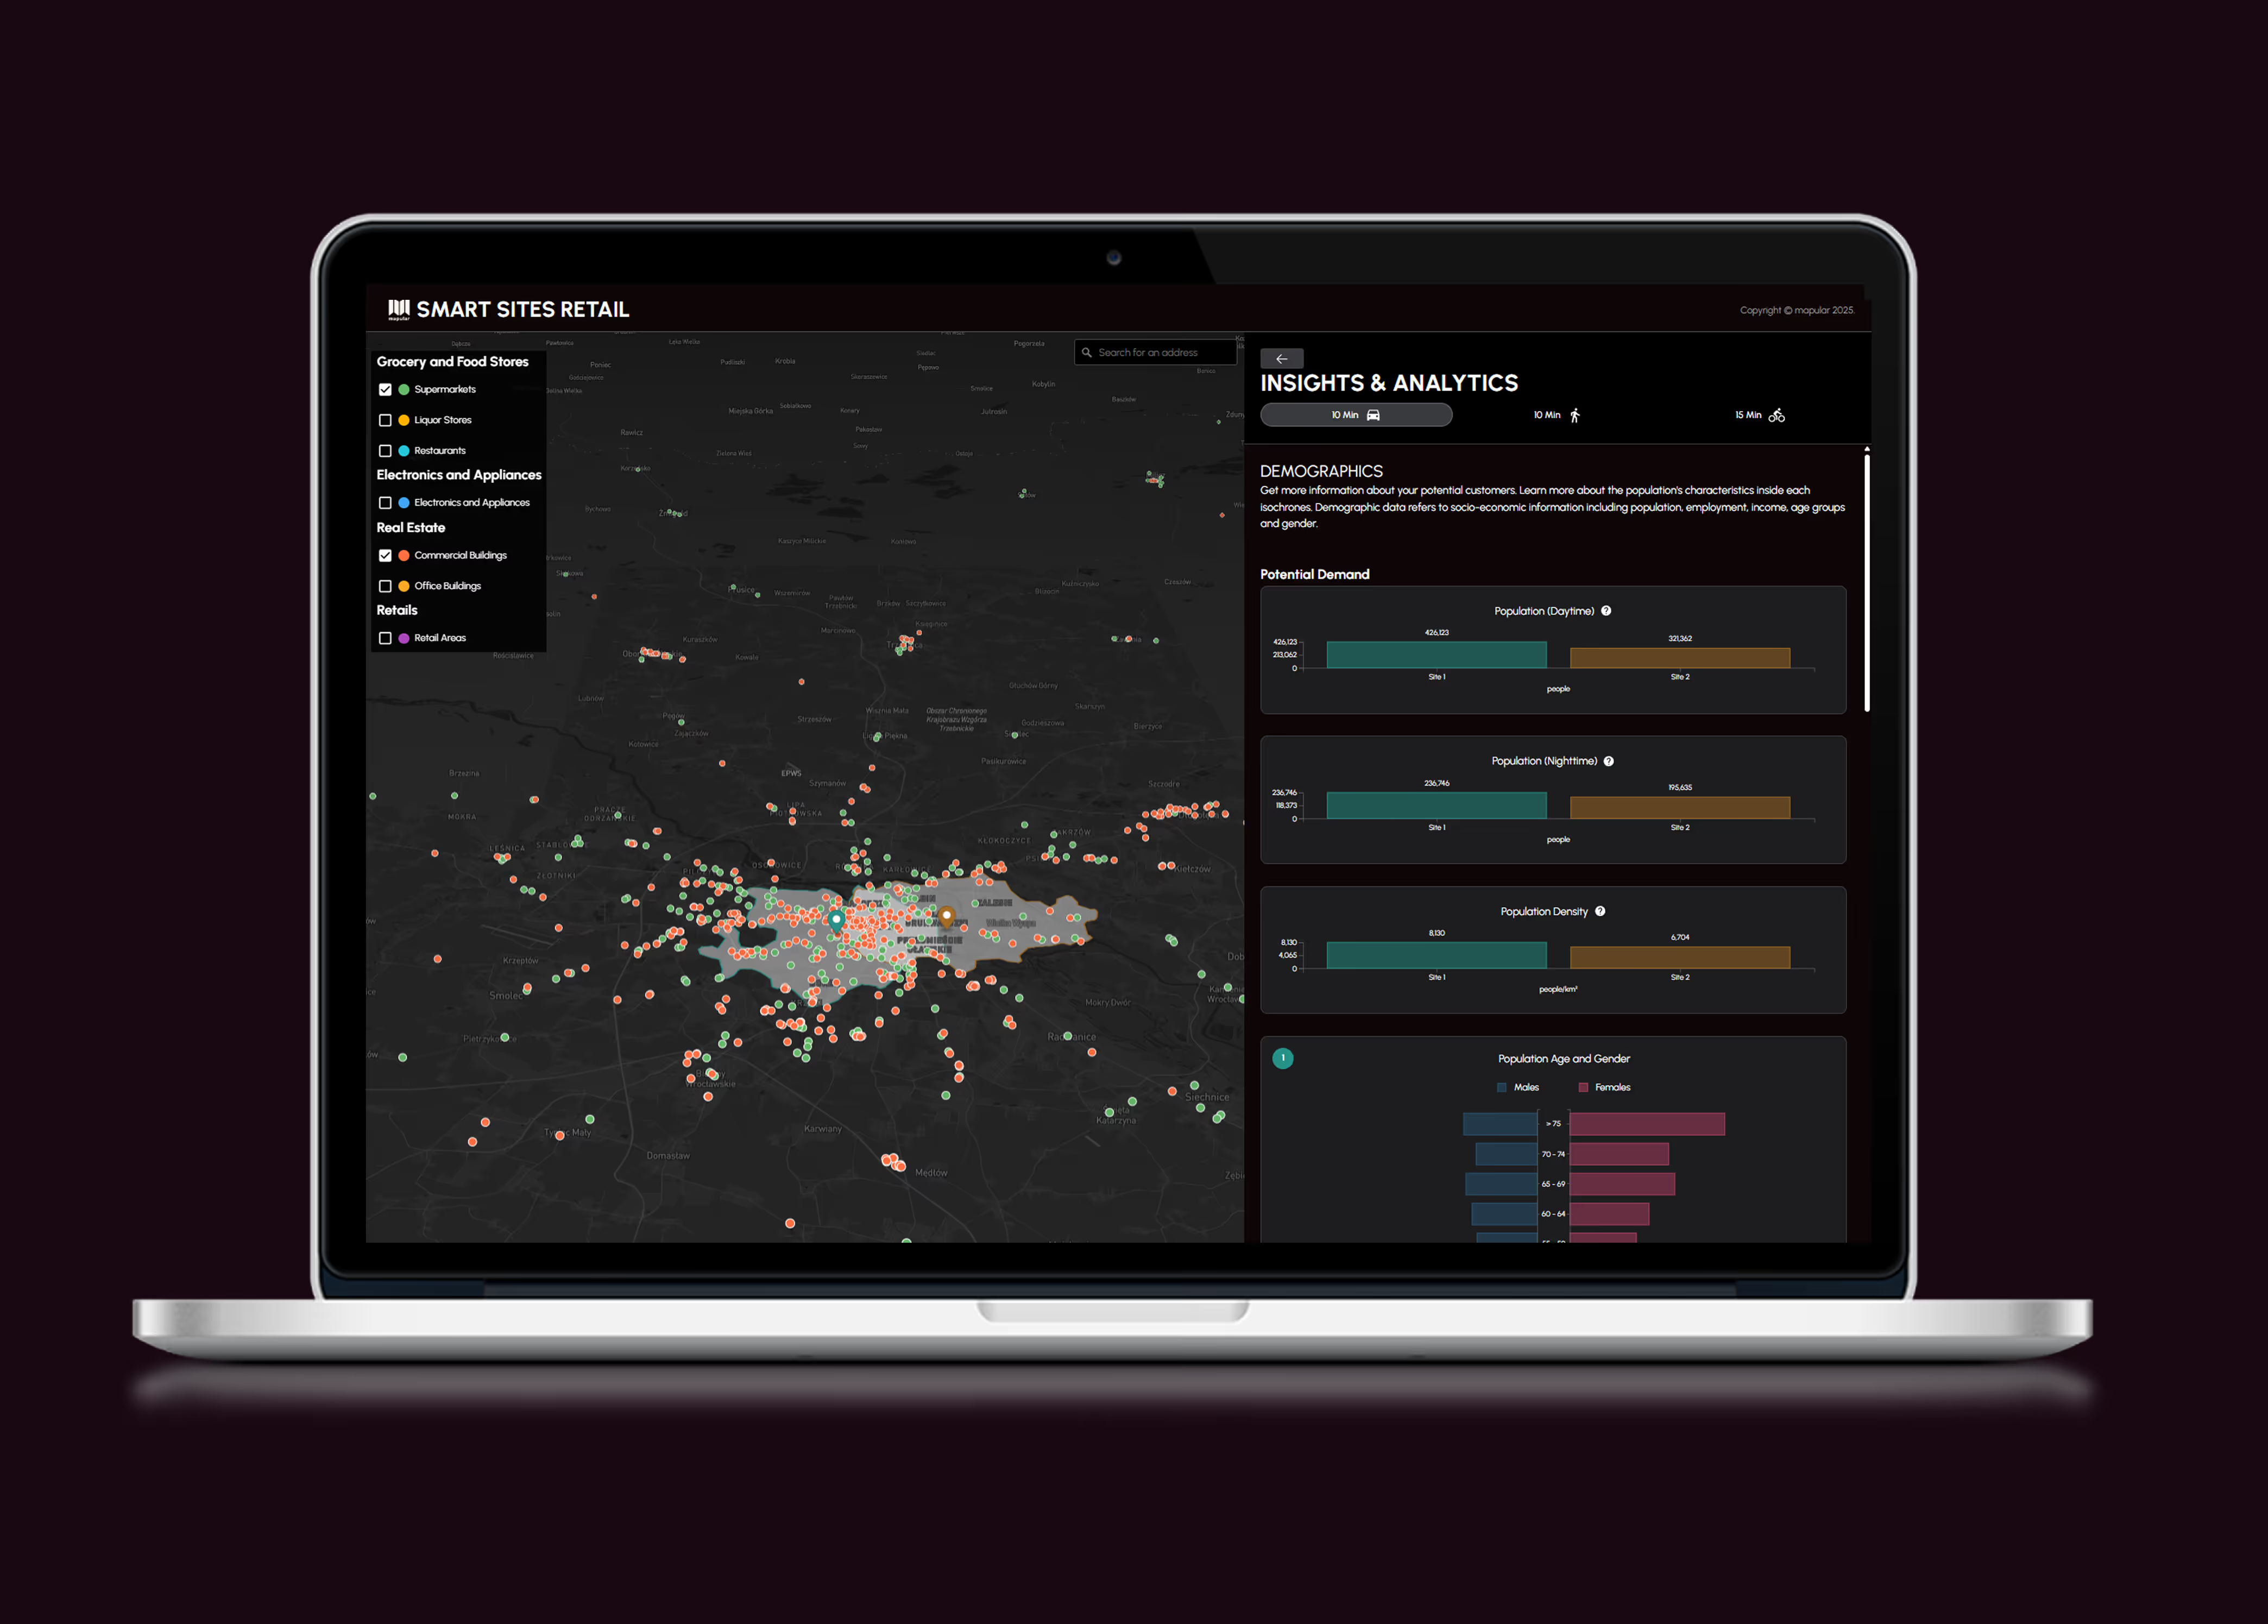
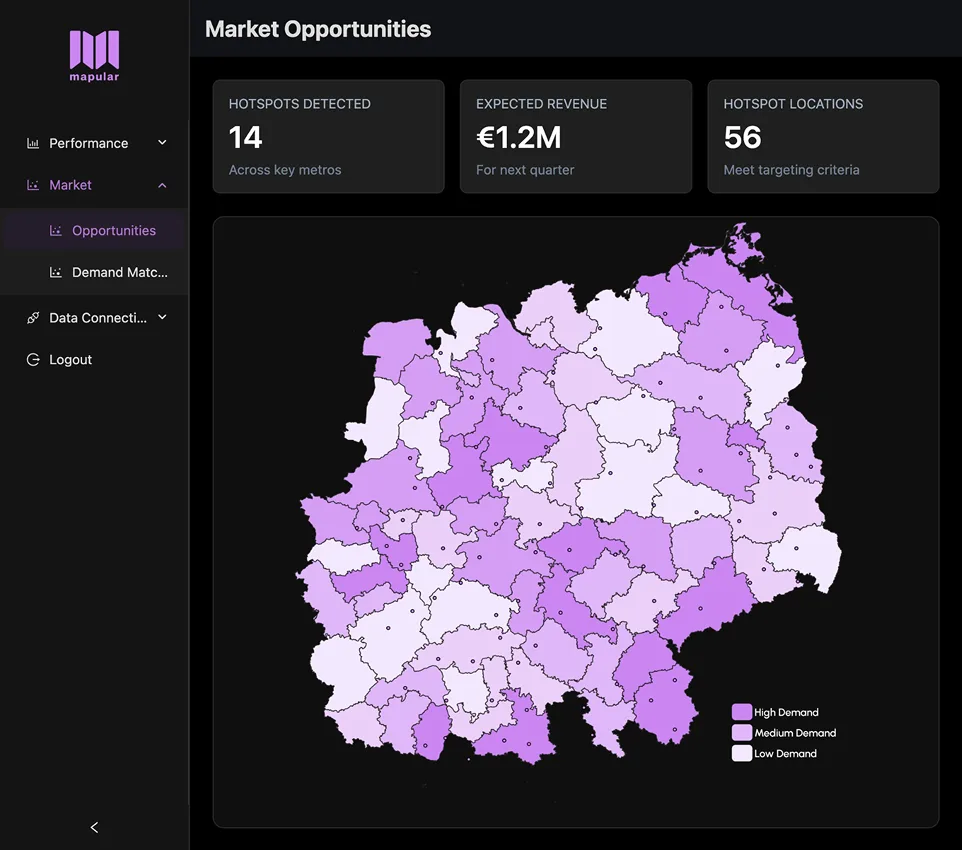
- A visual map that highlights regions with strong consumer potential
- A ranked list of high-opportunity areas for listings or activations
- Retailer-ready materials to back your next negotiation or rollout
- A demand-to-coverage ratio that quantifies how underserved each region is
Fast. Clear. Insights in under 14 days, typically around 5 days for pilots.
In Three Simple Steps, You Have Your Growth Map
Step 1: Connect Your Data
Provide a quick CSV export for a one-off pilot, or set up an API connection for ongoing updates. Data inputs include Shopify sales, Google Ads, Meta campaigns, Klaviyo engagement, demographic data, and your retailer lists. Our pipelines handle ingestion and geographic normalization, so your team can hand off exports directly from the platforms they already use.
Step 2: We Run the Analysis
Our system ingests, processes, and analyzes your data automatically. The methodology weights each signal based on its relevance to retail expansion, then layers it against third-party market indicators to separate genuine high-opportunity zones from areas where one metric looks strong but the broader picture does not support expansion. Insights are delivered in under 14 days, typically around 5 days for pilots.
Step 3: Get Your Growth Map
The deliverable is a ready-to-use Retail Opportunity Map that includes:
- A visual overlay of demand versus current coverage at the zip-code level
- Separate overlays for demand and coverage, plus a combined demand-to-coverage ratio map showing both relative gaps and total demand
- A ranked opportunity list that highlights the most promising regions and retailers to prioritize next
Format: PDF map for presentations and stakeholder alignment, plus an interactive version for deeper exploration by your planning team.
Integrating Demand Data into Your Planning Cycle
The most effective brands do not treat opportunity mapping as a one-time exercise. They integrate demand data into their annual and quarterly planning cycles. Here is how that typically works.
Annual Planning
At the start of each planning cycle, run a full opportunity mapping analysis to establish your baseline. This gives leadership a data-backed view of the top growth regions for the coming year and informs budget allocation for regional activations, trade marketing, and sales team focus areas.
Quarterly Reviews
Refresh the analysis each quarter with updated e-commerce and campaign data. This allows your team to track whether demand patterns are shifting, whether new regions are emerging, and whether the regions you targeted in the annual plan are performing as expected.
Retailer Negotiations
When approaching a new retail partner or pitching expanded shelf space, the opportunity map becomes a persuasion tool. Instead of saying "we believe there is demand in this region," you can show exactly where unmet demand exists and how much revenue potential it represents.
Campaign Planning
Marketing teams can use the opportunity map to prioritize regions for paid media, influencer partnerships, and sampling programs, focusing spend where high demand and low coverage create the greatest conversion opportunity. For a deeper look at how retail analytics informs location decisions, see our dedicated post on the topic.
KPIs to Track After Acting on Opportunity Insights
Once you have used opportunity mapping to guide expansion decisions, track these metrics to measure whether the analysis translated into results:
- New listings in target regions. Track the number of new retail doors opened or partner agreements signed in the top-ranked opportunity regions.
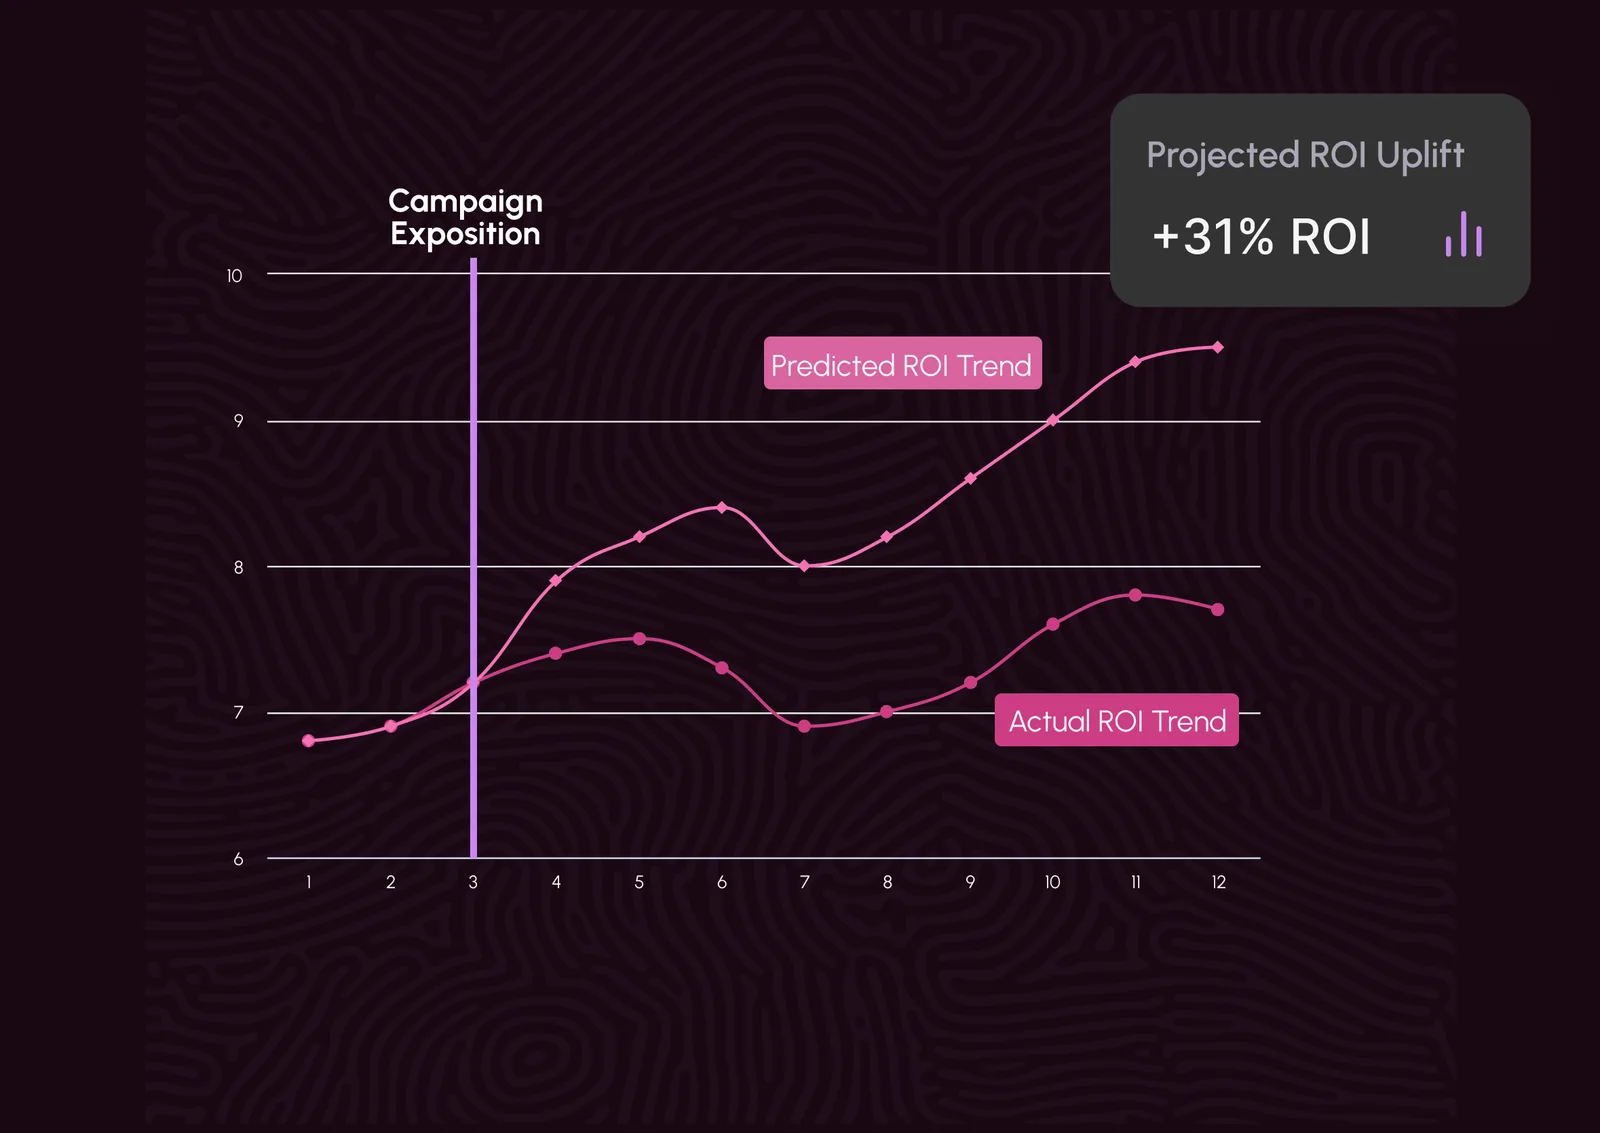
- Sell-through rate by region. Monitor how quickly product moves off the shelf after listing. High sell-through validates the demand signal; slow sell-through may indicate the region needs additional marketing support.
- Online-to-offline conversion. Compare e-commerce order volume in a region before and after retail availability. A decrease in online orders paired with strong retail sales indicates successful channel migration.
- Cost of customer acquisition by region. Expanding into high-demand regions should lower acquisition cost compared to entering markets where you need to build awareness from scratch.
- Retailer satisfaction scores. Partners who see strong sell-through will be more receptive to expanding the relationship, creating a positive feedback loop for future growth.
These KPIs close the loop between planning and performance, turning opportunity mapping into a measurable, repeatable process.
Turning Data into Retail Decisions
The real power of this approach is in the decisions it unlocks.
- Trade marketing teams use it to plan activations in regions where interest already exists but listings are thin, maximizing the return on every activation dollar.
- Sales leaders use it to open conversations with retailers who want proof of demand before committing to new shelf space. A zip-code-level demand map is more persuasive than a national sales figure.
- Founders and CMOs use it to prioritize growth markets and justify expansion plans with hard data. Board presentations and investor updates become more credible when backed by geographic demand analysis.
It is not about replacing existing data. It is about completing the picture and giving every team a shared, geographic lens through which to evaluate growth options. For a more detailed look at how this methodology works in practice, see our post on how retail opportunity mapping turns scattered data into clear growth regions.
From "We Think" to "We Know"
Planning retail growth will never be entirely free of uncertainty, but it does not have to feel like staring into a crystal ball. When you can see where demand is rising and where you are not yet present, every decision becomes faster, clearer, and easier to defend. When the entire organization is working from the same geographic intelligence, decisions move faster because there is less to debate. Marketing, sales, and leadership converge on the same priorities because they are looking at the same map.
Conclusion
The data you need to plan next year's retail growth already exists inside your e-commerce platform, your advertising accounts, and your CRM. The challenge is not collecting more data. It is connecting the data you have into a geographic view that reveals where demand is unmet and where expansion will deliver the strongest return.
Retail Opportunity Mapping provides that view. It is fast, it is built on your own data, and it delivers results your team can act on within your planning timeline. Whether you are preparing for annual budget discussions, building a case for a new retail partnership, or deciding where to focus your next regional activation, demand data gives you the evidence to move forward with confidence.