Analytics: Brands
See What Drives Sales:
From Campaigns to In-Store.
For D2C and consumer brands expanding through retail. Track demand, prove ROI, and grow smarter across every store, partner, and product.
Where Brands Struggle
Flying Blind in Retail
As a brand, you're flying blind in retail. You can't see:
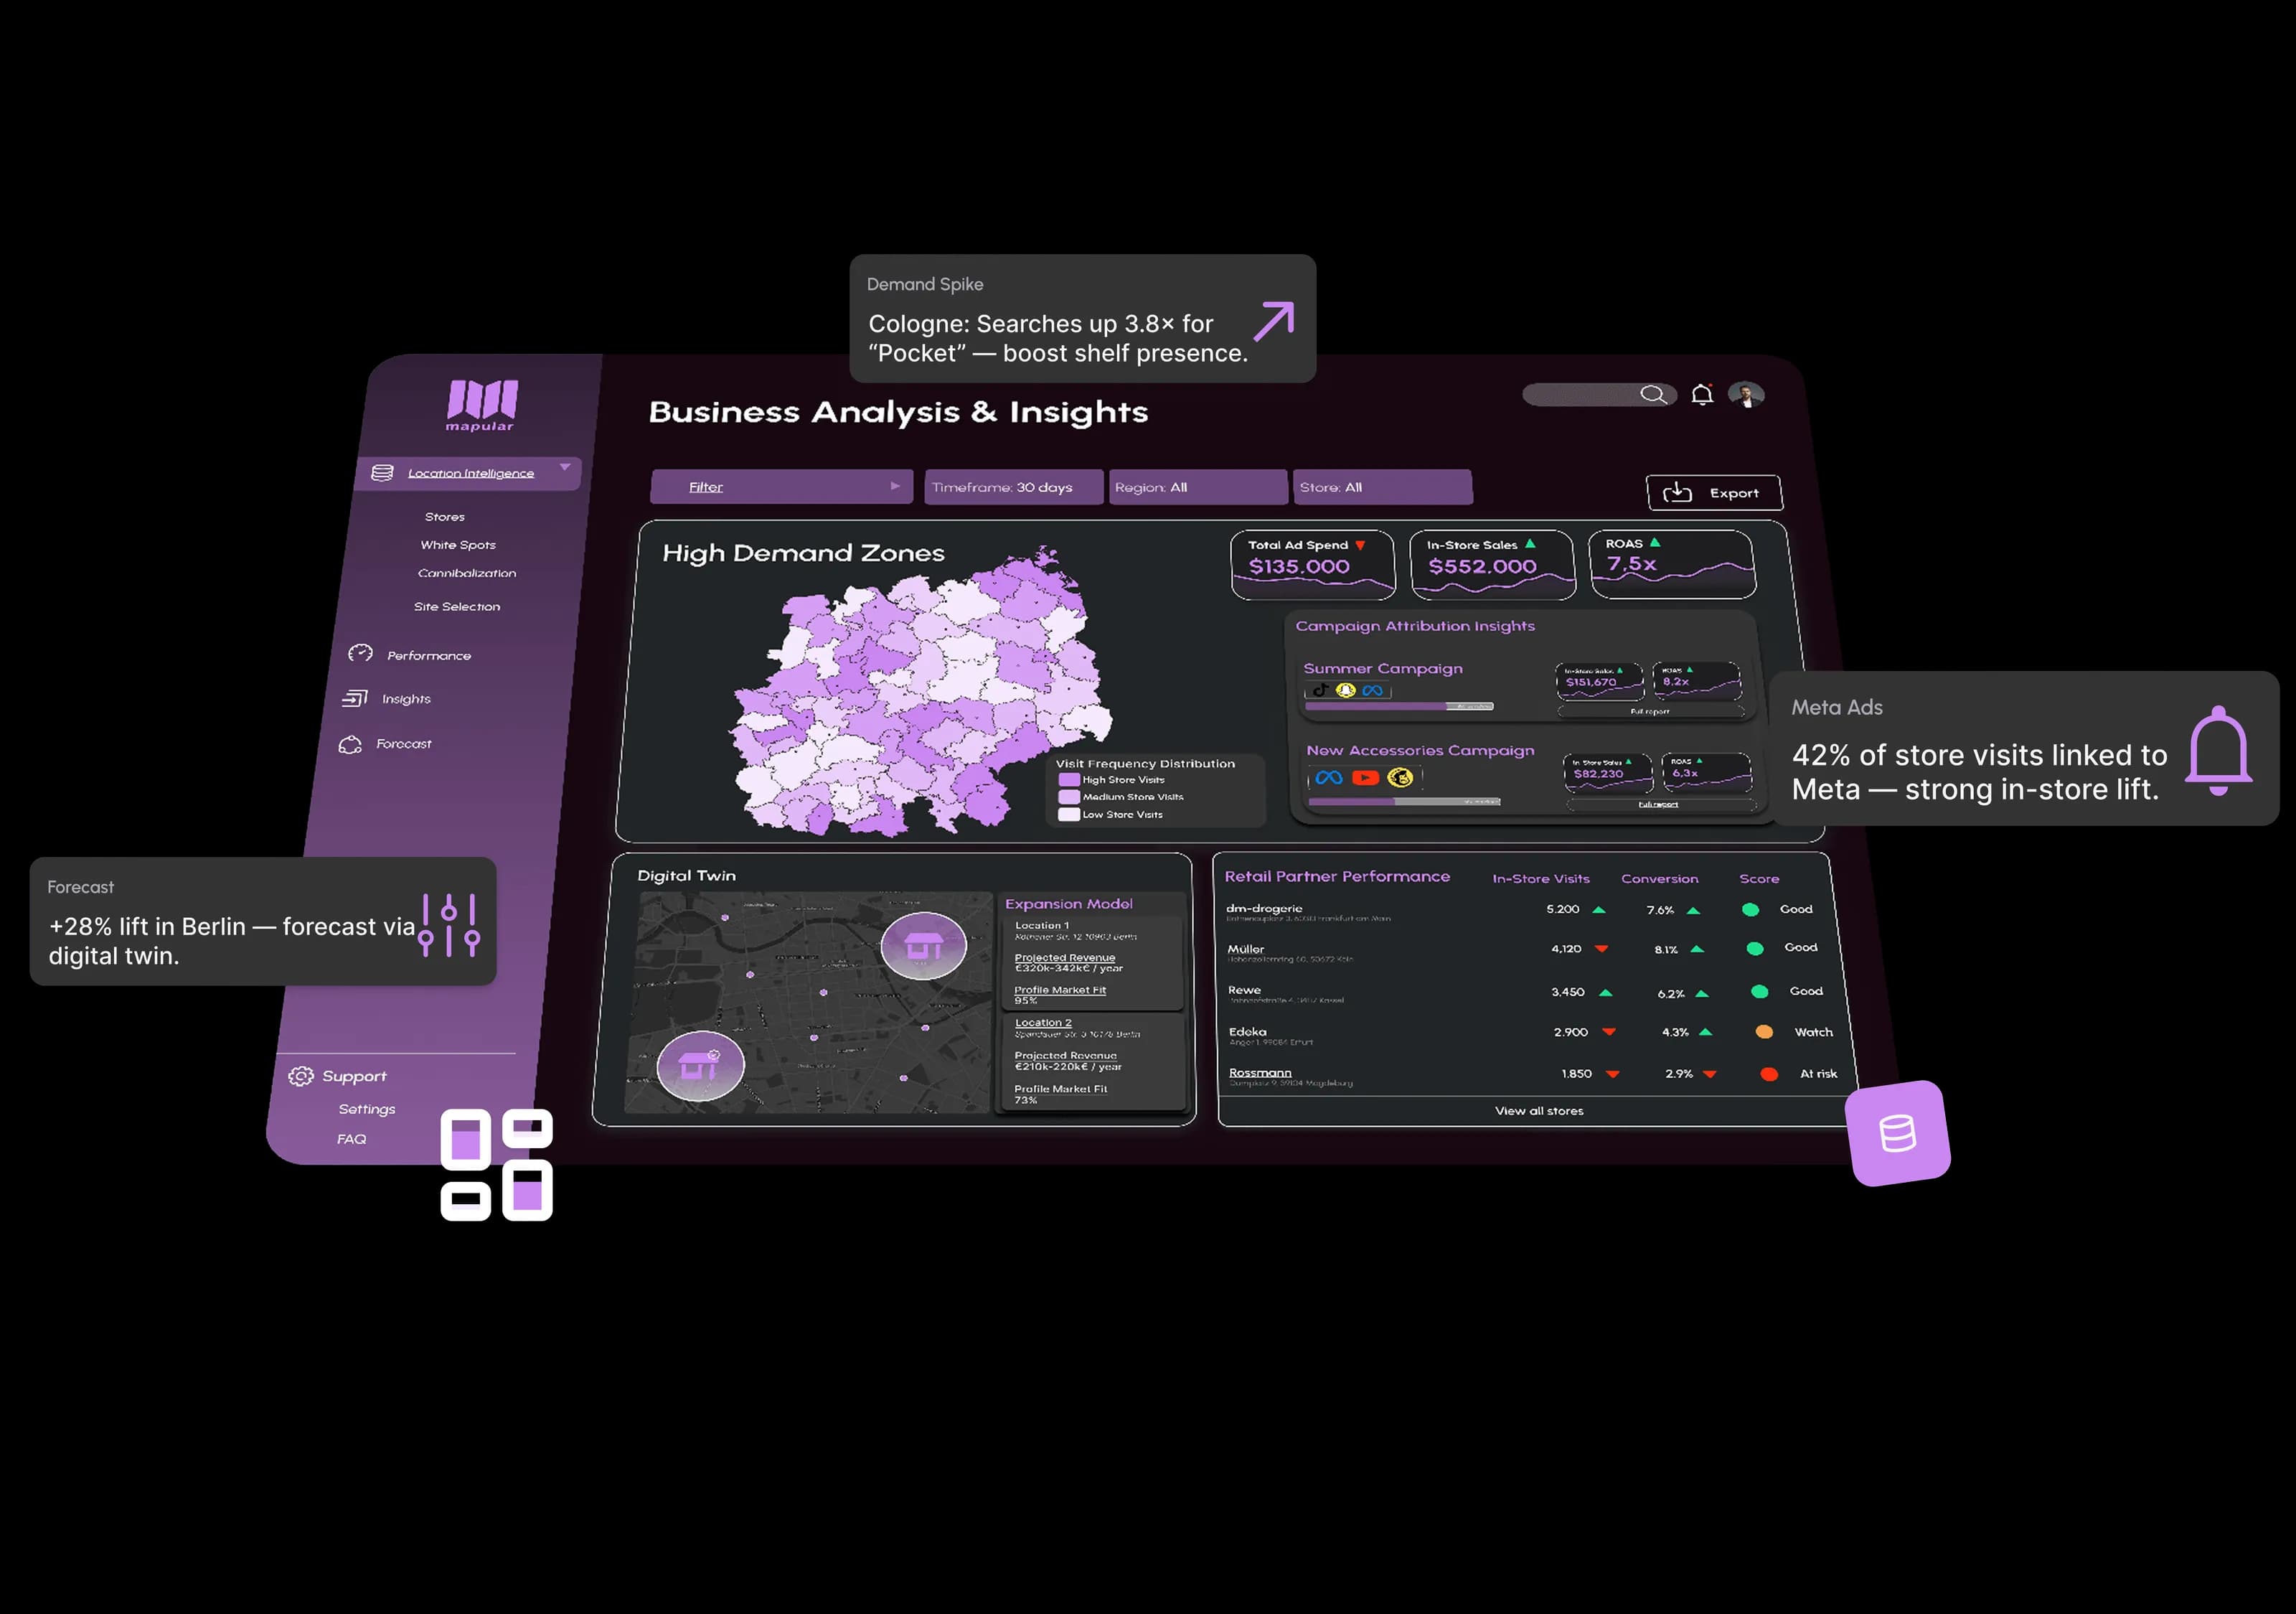
Location-Based Demand Signals
Who's looking for your products, or where.
Geo-Linked Campaign Insights
Which campaigns drive in-store visits.
Retail Partner Performance by Location
How each retail partner is performing.
The Full Picture
Mapular Gives You the Full Picture
Make smarter, faster, revenue-driving decisions with location, consumer, and marketing data in one place.
Activate First-Party Signals
We plug into your store locator, CRM, and campaign platforms to instantly surface demand trends by region, product, or store, all in a single, unified dashboard.
Attribute Marketing to Store Visits
Track which ads, emails, and content drive real-world traffic, no Point of Sales (POS) data needed.
Monitor Brand Presence & Retailer Performance
Track how your brand performs across every retail partner. Identify who's driving growth and who's underperforming.
Simulate Campaigns & Product Launches
Use digital twins to test new campaigns, locations, or in-store promotions before launch.
Who This Is For
Built for Retail-Expanding Brands
D2C and consumer brands that sell through retail partners or their own stores and want more visibility, are launching or expanding their in-store presence, or need to connect digital spend to physical world results.
FAQ
Common Questions
What data sources does Mapular use for brand analytics?
Mapular draws on foot traffic data, transaction signals, and mobility patterns from multiple verified providers. These are combined with your first-party store locator and campaign data to give a complete picture of consumer behavior by location.
How is consumer analytics different from traditional market research?
Traditional market research relies on surveys and panel data that can take months to collect. Mapular uses real-time, granular location data so you can see what consumers are actually doing, not what they say they do, and act on it immediately.
Can I see competitor performance?
Yes. Mapular lets you benchmark your brand against competitors across any trade area. See how their foot traffic, visit frequency, and catchment areas compare to yours, at the market or individual location level.
What formats can I export data in?
You can access insights through interactive dashboards, CSV exports, API access, or custom reports tailored to your reporting workflows. We work with your existing BI and data infrastructure.
How quickly can we get started?
Most clients are up and running within days, not months. There is no hardware to install and no long implementation project. We connect to your existing data sources and configure your dashboards based on your specific goals.
Ready?
See Mapular
in Action.
Book a free 30-minute demo. We'll show you exactly how the platform works for your use case, with no generic slides and no obligation.