Platform
Orchestrate Site Selection
Decisions, at Scale.
A location intelligence workspace for spreadsheet-native teams to shortlist, compare, and justify new sites, without GIS complexity.
Consistent rollout decisions across markets and expansion cycles.
Build and maintain prioritized site pipelines, identify coverage gaps, compare locations on a common basis, and prepare outputs that support investment discussions.
How It Works
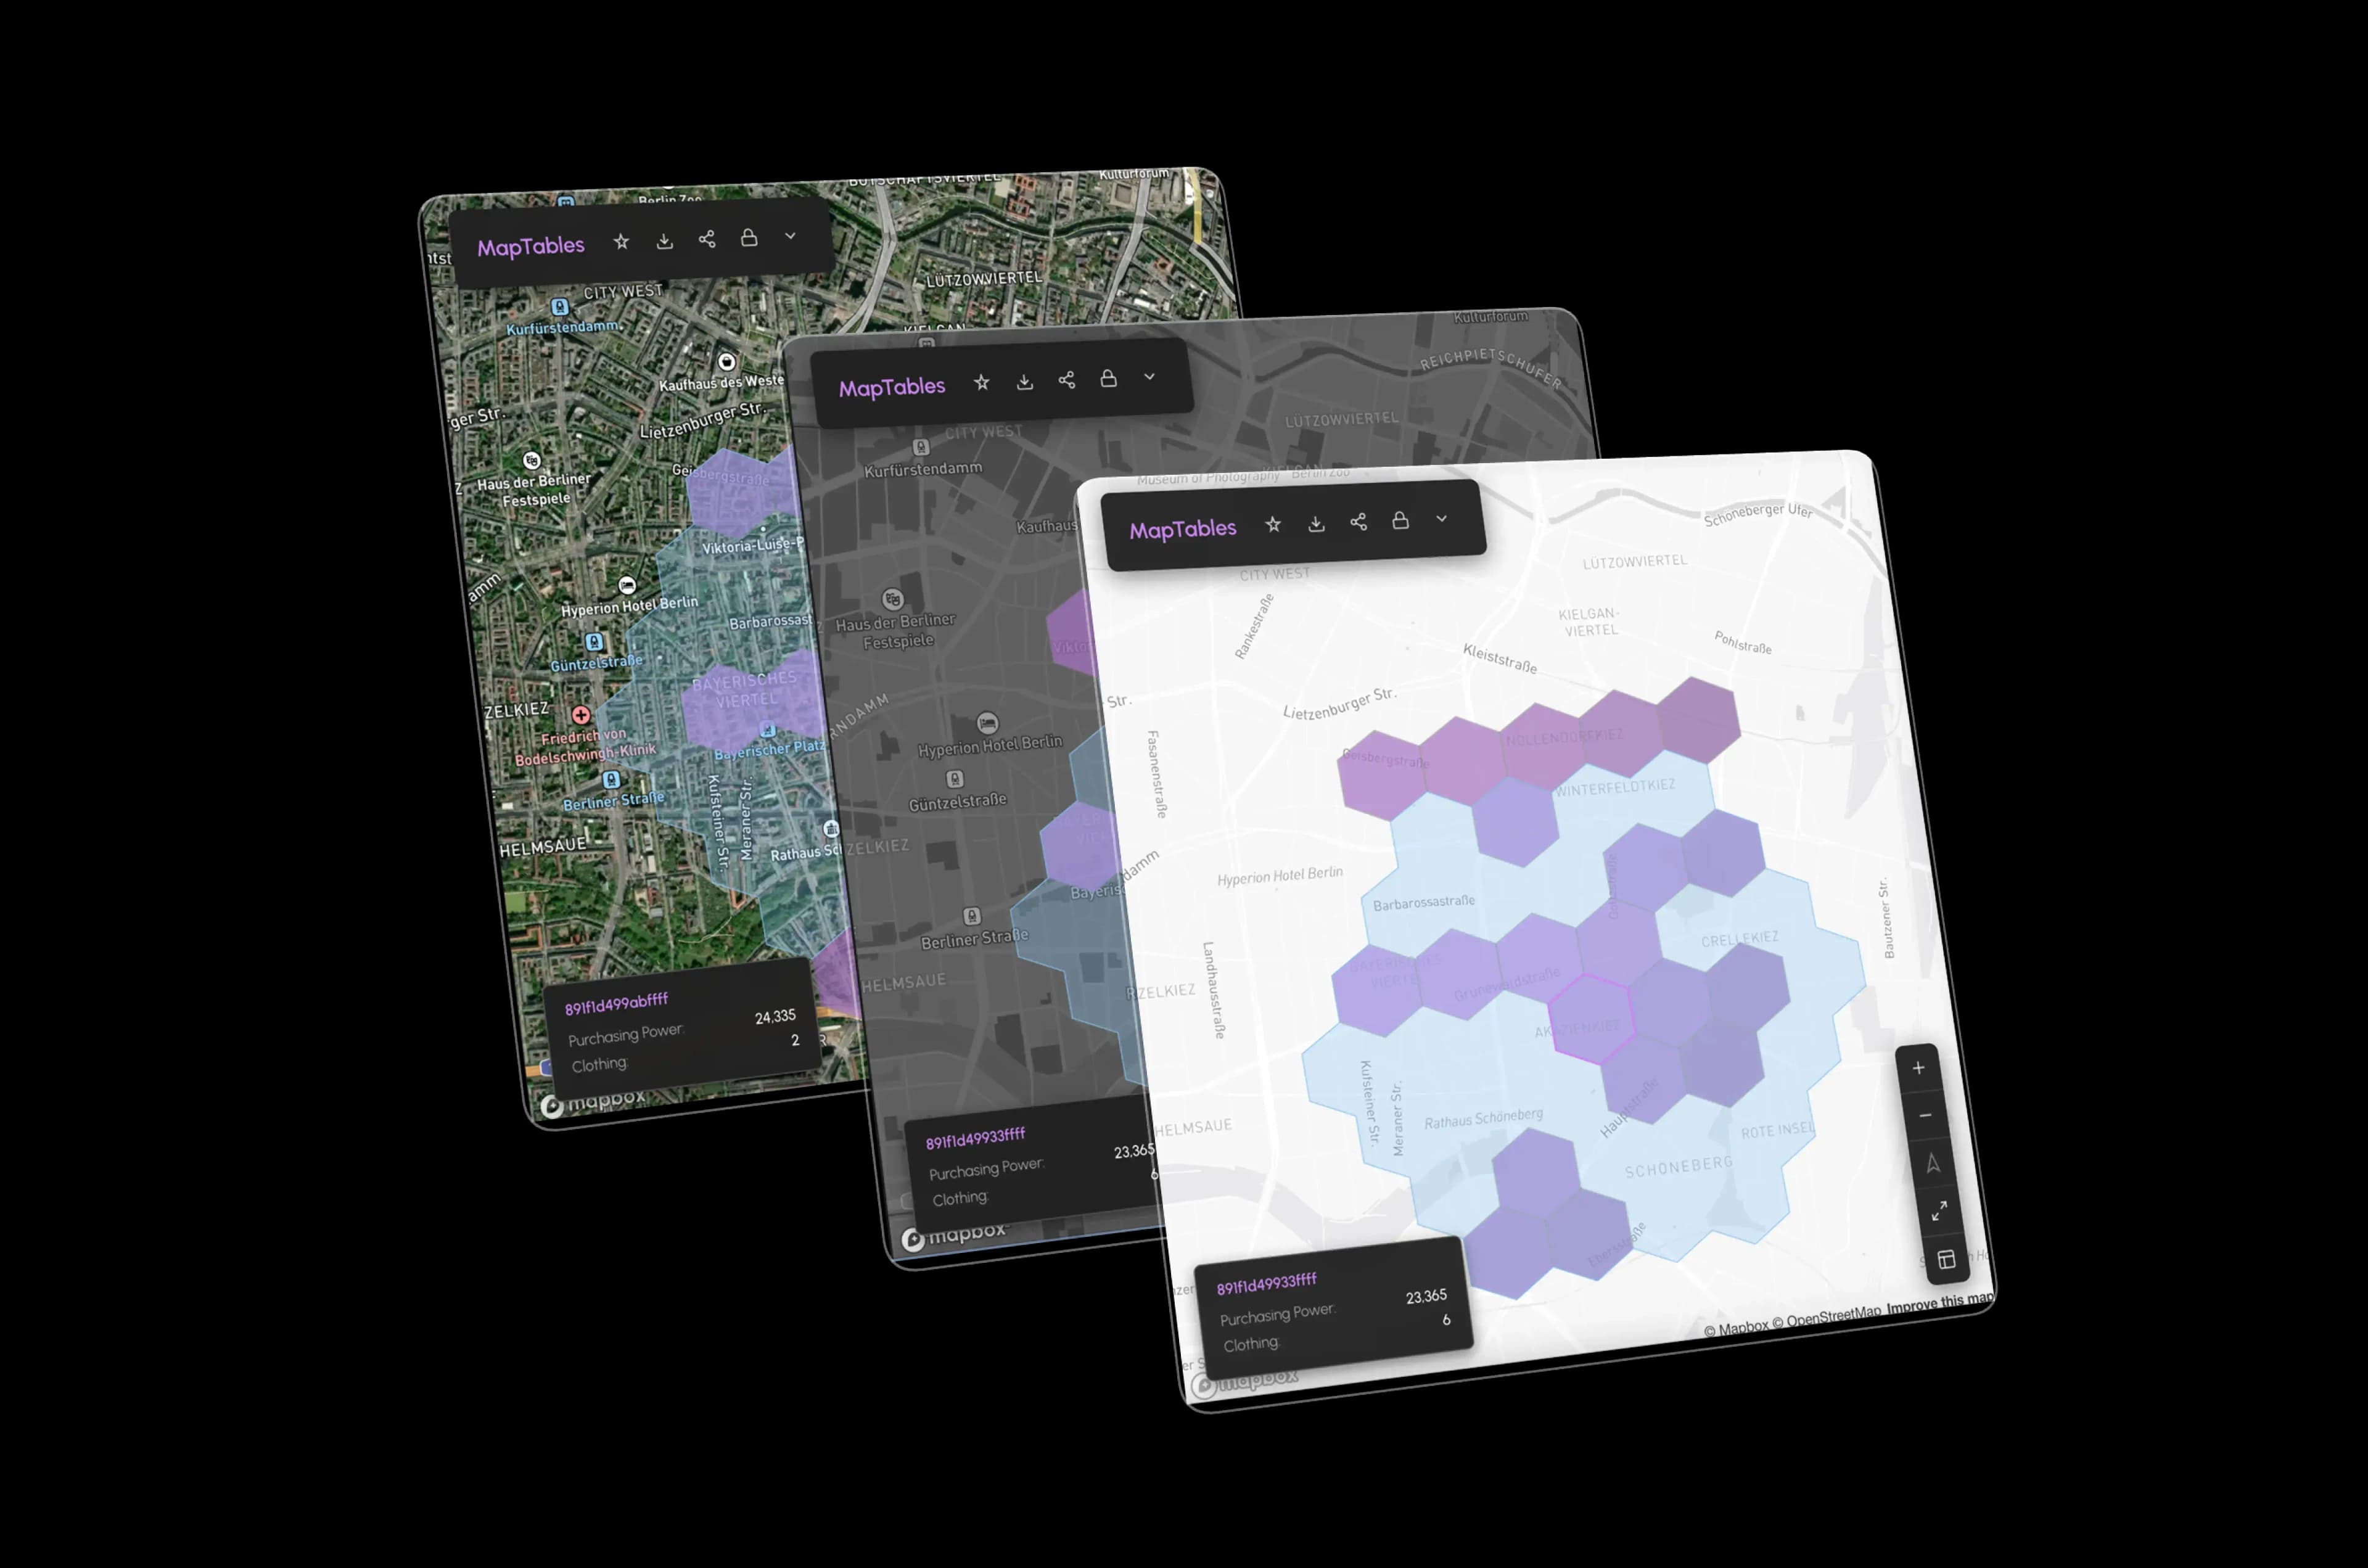
Make Location Data as Easy as a Spreadsheet
Use familiar spreadsheet-native operations to analyze built-in market, demographic, and location data. Integrate third-party sources, apply simple transformations, and combine everything with your own data, all kept in sync with a live map.
Start Expansion Planning at Market Level
Identify priority markets and zones before evaluating individual sites.
- Combine ready-to-use market and demographic data with your own store locations, competitors, and anchors
- See where demand is underserved and expansion will have highest impact
- Focus resources on the right markets before drilling into individual sites
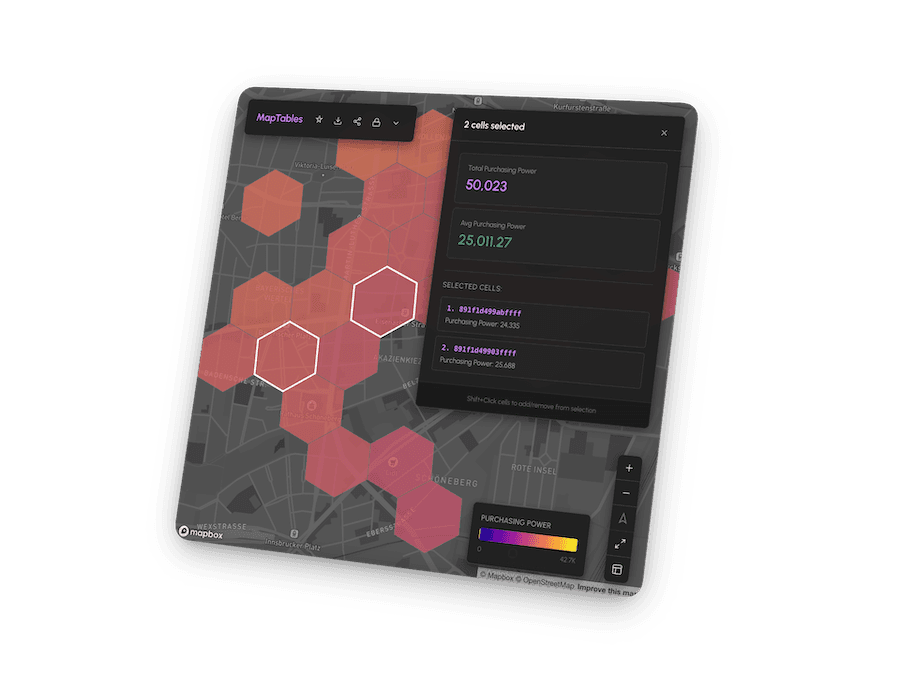
Evaluate Sites in Full Local Context
Compare candidate locations using the same criteria, regardless of region or source.
- Each location viewed against competition, complementary POIs, and socio-demographic profiles
- Decisions based on comparable, location-specific insights, not intuition
- Catchment analysis with walk, drive, and transit accessibility
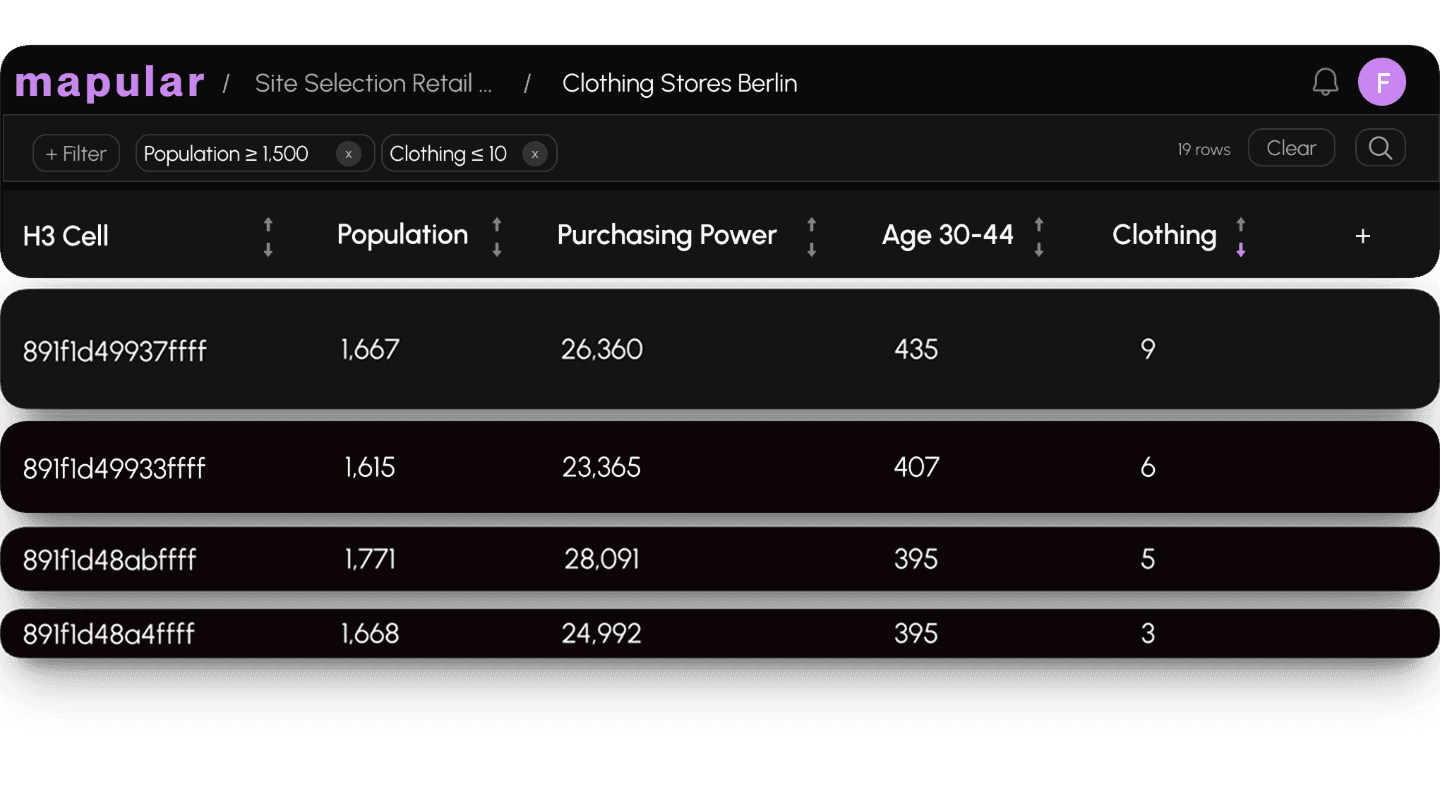
Rank, Prioritize & Share
Turn long lists into clear, ranked priorities with consistent scoring logic.
- Create ranked site shortlists that help teams align quickly
- Export data directly to spreadsheets to continue working in existing tools
- Share exact map views with finance, leadership, or external partners
Decision-Ready Outputs
From Analysis to Action
Prepare outputs that support investment and approval discussions without creating additional work.
Ranked Shortlists
Prioritized site lists based on consistent scoring criteria
Coverage Maps
White-space views showing where footprint is strong and where demand is underserved
Spreadsheet Exports
Export data directly to continue working in existing tools
Shareable Views
Share exact map views with finance, leadership, or franchise partners
Built-In Data
What Data Powers Mapular
Ready-to-use datasets for Germany and the USA, pre-harmonized and immediately usable without GIS expertise or custom setup.
Points of Interest
Anchors, complementary businesses, and competitors, mapped and categorized for competitive context.
Travel-Time Catchments
Walk, drive, and transit accessibility polygons to define realistic catchment areas.
Network Context
Existing store locations and coverage analysis to reveal overlaps and white-space opportunities.
Socio-Demographic Data
Population, income, age, and demand profiles at granular geographic levels.
Your Own Data
Upload custom locations, territories, and sales metrics, then combine them with built-in layers.
We are so excited to work with Mapular as our full-service geomarketing partner. The custom store locator map their team built for Black Buffalo is truly the best I've seen in the industry and resulted in immediate ROI in terms of consumer engagement, retail foot traffic, and industry attention. Beyond the consumer-facing store locator map, Mapular brings to our team a wealth of analytical knowledge that's helping us make high-level decisions at the retail level where otherwise we would be completely in the dark.
Zach Miller
VP Digital Consumer Experience at Black Buffalo
Coming Soon
On Our Roadmap
Footfall and traffic indicators
Deeper accessibility and mobility context
Guided first-party data integration
Advanced network and scenario analysis
GeoJSON file uploads
Data Coverage
Ready-to-Use Data for Germany & the USA
Mapular provides pre-harmonized datasets for Germany and the USA, immediately usable without GIS expertise or custom setup. Demographics, mobility, competitor data, and POIs all in one workspace.
FAQ
Common Questions
What data goes into a site selection analysis?
A Mapular site selection analysis draws on demographics, foot traffic patterns, competitor proximity, accessibility by walk, drive, and transit, and local spending power. You can also upload your own store network and sales data to combine with these built-in layers.
How long does a typical site selection project take?
A standard market analysis typically takes 2 to 4 weeks from kickoff to final outputs. The timeline depends on the number of candidate sites and how much custom data needs to be integrated.
Can I compare multiple potential sites side by side?
Yes. The platform is built for multi-site comparison. You can score and rank any number of candidate locations using consistent criteria, and view them together on a live map to support investment discussions.
Do you cover markets outside Germany?
Yes. Mapular currently provides ready-to-use data for Germany and the USA. European expansion is on the roadmap, and custom coverage for other markets is available on request.
What makes Mapular different from traditional site selection consultants?
Traditional consultants deliver a static PDF report that you cannot update or reuse. Mapular gives you an interactive platform that your team keeps. You can re-run analysis as new sites become available, adjust scoring criteria, and share live map views with stakeholders.
Ready?
See Mapular
in Action.
Book a free 30-minute demo. We'll show you exactly how the platform works for your use case, with no generic slides and no obligation.